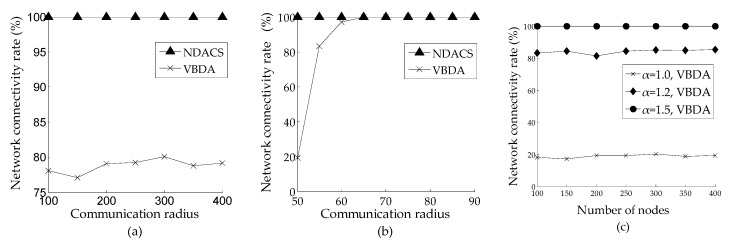
Figure 10.
Comparison of network connectivity rate between NDACS and VBDA: (a) comparison of network connectivity rate between NDACS and VBDA varying with number of nodes, and the initial communication radius is 60 m; (b) comparison of network connectivity rate between NDACS and VBDA varying with communication radius, and the default number of nodes is 200; (c) network connectivity rate of VBDA varying with number of nodes on different values of α.

