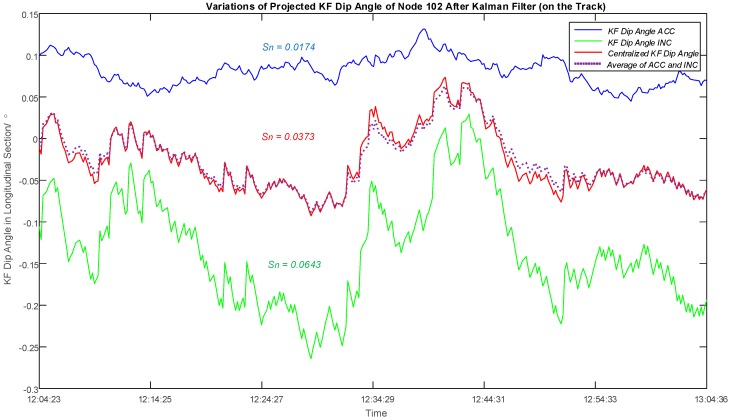
Figure 12.
Plots of Dip Angle Variations after Kalman Filter of Node 102 (on the Track) in the Longitudinal Section During the Second Measuring Hour. Blue and green lines are results after Kalman filter for the accelerometer and inclinometer respectively, and the red line shows the result solved by a centralized Kalman filter based on the tilt values from two sensors. The standard deviation of the red line is higher than that of the blue line and lower than that of the green line. The purple dot line displays the average of the blue and green lines.

