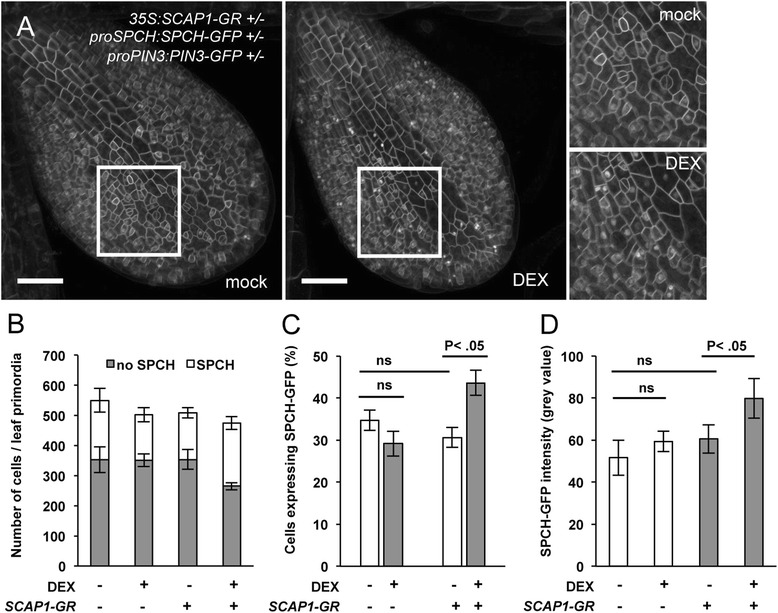
Fig. 6.

SCAP1 promotes SPCH protein accumulation. (a) Representative picture of the 1st leaf primordia of mock or DEX–treated triple hemizygous proPIN3:PIN3-GFP proSPCH:SPCH-GFP pro35S:SCAP1-GR transgenic plants. Insets show a portion of the primordia at higher magnification. PIN3-GFP fusion protein marks the plasma membrane of epidermal cells. SPCH-GFP fusion protein localises in nuclei of the epidermis. Scale bar = 500 μm. (b and c) Quantification of nuclei accumulating SPCH-GFP in leaf primordia of mock (−) or DEX (+) treated plants. Double hemizygous proPIN3:PIN3-GFP proSPCH:SPCH-GFP were used as control (−) and compared to triple hemizygous proPIN3:PIN3-GFP proSPCH:SPCH-GFP pro35S:SCAP1-GR (SCAP1–GR, +). Bars represent the number of total epidermal cells forming the 1st leaf primordium imaged at 5 das. White bars represent the number of nuclei containing SPCH-GFP. Grey bars are nuclei with no detectable SPCH-GFP. n = 6–8 independent first leaf primordia. This experiment was performed twice with similar results. (c) Same data as (b) but shown as a percentage of nuclei expressing SPCH-GFP protein over the total number of cell composing leaf primordia (d) Quantification of the mean fluorescence intensity of nuclear SPCH-GFP protein in the indicated backgrounds/treatment. Data derived from the analysis of approx. 50 nuclei expressing SPCH-GFP in 6–8 independent first leaf primordia. In (c) and (d) P values denote a statistical significance in the number of SPCH-GFP nuclei or intensity of SPCH-GFP fluorescence, respectively, calculated with one-way ANOVA. NS = not significant. Error bars = Standard Error
