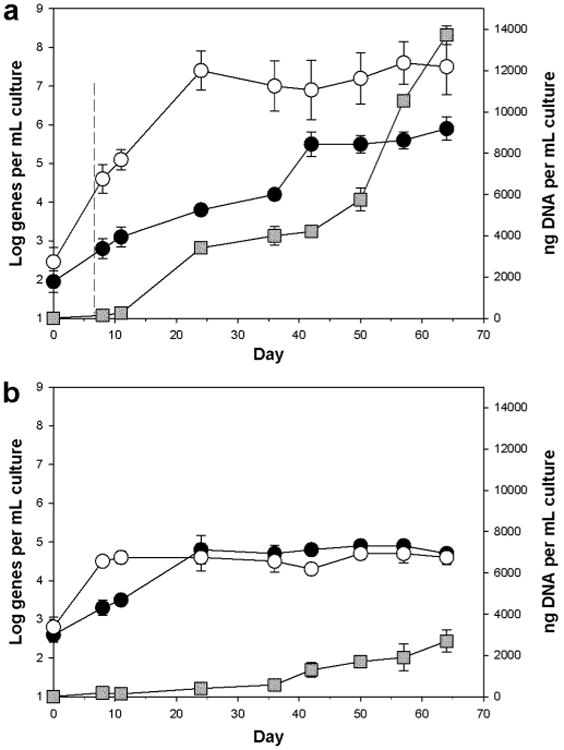
Figure 2.

Abundance of Polycyclovorans algicola TG408 (solid circles) and Marinobacter (open circles) 16S rRNA genes in incubations of non-axenic S. costatum strain CCAP1077/1C amended with (a) or without (b) ANS crude oil – respectively flasks O1-3 and C4-6. Each circular point on the graph represents the average and standard deviation of triplicate qPCR measurements calculated as the abundance of 16S rRNA genes per mL of culture. Squares are the average and standard deviation of triplicate measurements of the total mass of DNA per sample. The hatched line at day 7 (top panel) indicates the time-point the oil was added. Some error bars are smaller than the symbol.
