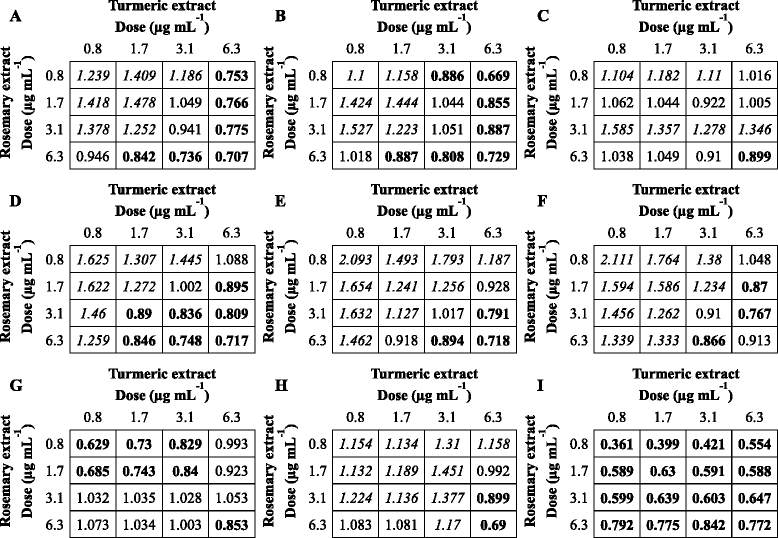
Table 4.
Combinatorial effects of TE/RE and chemotherapy on tumor cell proliferation

|
Combination Index (CI) values on C2 (A-C), CMT-12 (D-F), and D17 (G-I) cell lines treated with TE and RE in combination at doses of 0.8, 1.7, 3.1, and 6.3 μg mL−1 in the presence of chemotherapeutic agents. Toceranib phosphate used for C2 cell line at (A) IC25 dose of 6.3 nM, (B) IC50 dose of 12.5 nM, and (C) IC75 dose of 12.5 nM; doxorubicin hydrochloride was used for the CMT-12 cell line at (D) IC25 dose of 0.1 μM, (E) IC50 dose of 0.3 μM, and (F) IC75 dose of 1 μM; doxorubicin hydrochloride was used for the D17 cell line at (G) IC25 dose of 0.3 μM, (H) IC50 dose of 0.5 μM, and (I) IC75 dose of 2 μM. CI values ≤ 0.9 indicate synergism (bold values), a CI value >0.9 and <1.1 indicates an additive effect, and CI values ≥1.1 indicate antagonism (italicized value)
