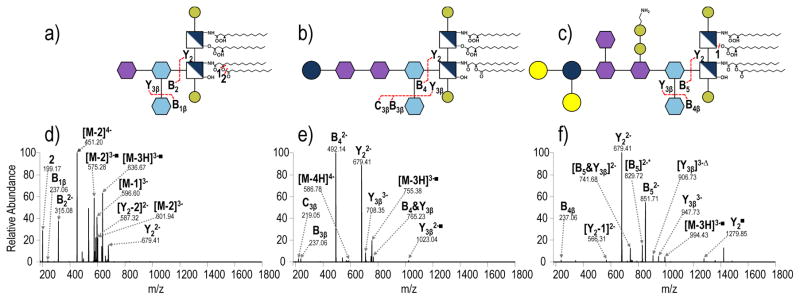
Figure 2.
CID (NCE 18) of the 4- charge state of a) tetra-acylated S. enterica Rd1 (m/z 497.25) b) tetra-acylated S. enterica Rc (m/z 585.78) and c) tetra-acylated S. enterica Rb (m/z 765.56) (25 spectra averaged, LPS concentration 100 μg/mL in 62:36:2 CHCl3:MeOH:H2O). ■= neutral loss of HPO3; & indicates that both of the indicated cleavages occur to generated a particular fragment ion. The acyl chains are numbered, and the loss of a particular acyl chain is denoted as M – N where M represents the LPS and N represents the acyl chain that is lost.

