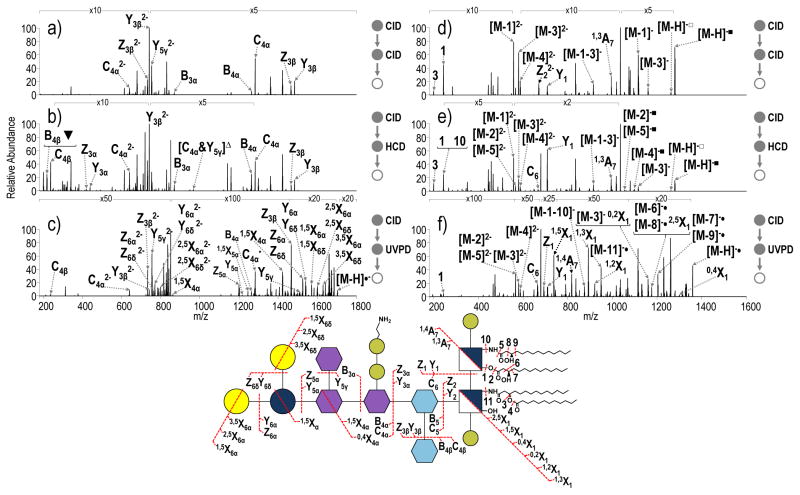
Figure 4.
a) CID-CID (NCE 18- NCE 30), b) CID-HCD (NCE 18- NCE 35) and c) CID-UVPD (NCE 18- 5 pulses, 2 mJ) of the core oligosaccharide substructure of tetra-acylated S. enterica Rb containing a pyrophosphoethanolamine modification (m/z 851.81, charge state 2-). d) CID-CID (NCE 18-NCE 30), e) CID-HCD (NCE 18-NCE 35) and f) CID-UVPD (NCE 18- 5 pulses, 2 mJ) of the lipid A substructure of S. enterica Rb modification (m/z 679.41, charges state 2-). A yellow star is used to denote the precursor. Only select neutral losses are labeled on the spectra to avoid congestion: ▼= loss of pyrophosphethanolamine; △= loss of phosphethanolamine; ■= loss of HPO3; □= loss of H2PO4; & indicates that both of the indicated cleavages occur to generated a particular fragment ion. The acyl chains are numbered, and the loss of a particular acyl chain is denoted as M – N where M represents the LPS and N represents the acyl chain that is lost.

