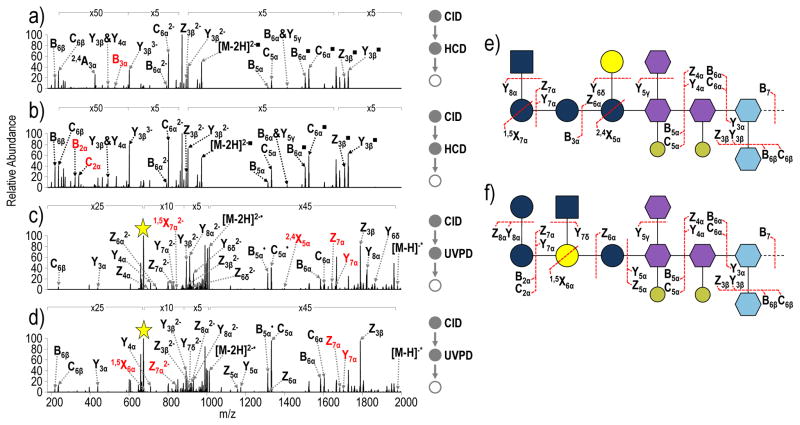
Figure 6.
a) CID-HCD (NCE 18- NCE 30) of the core oligosaccharide substructure of E. coli R2 (m/z 674.84, charge state 3-) b) CID-HCD (NCE 18- NCE 30) of the core oligosaccharide substructure of E. coli R3 (m/z 674.84, charge state 3-), c) CID-UVPD (NCE 18- 5 pulses, 2 mJ) of the core oligosaccharide substructure of E. coli R2 (m/z 674.84, charge state 3-) and d) CID-UVPD (NCE 18- 5 pulses, 2 mJ) of the core oligosaccharide substructure of E. coli R3 (m/z 674.84, charge state, 3-). Unique ions that can be used to identify each isomer appear in red. ■= neutral loss of HPO3; the yellow star indicates the precursor ion in the spectrum; & indicates that both of the indicated cleavages occur to generated a particular fragment ion

