
Fig. 3.
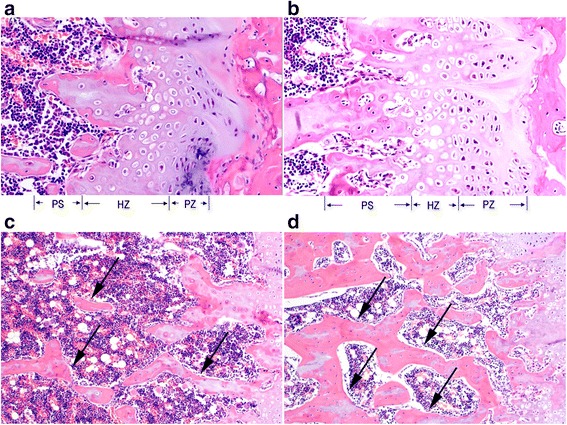
The representative histological images of the extremity distal femoral metaphysis in two groups. The chondrocyte zone images at growth plate (a, b) show that the CSD group (a) has a shorter proliferative zone (PZ), increased hypertrophic zone (HZ) of chondrocytes, and decreased osteoid content of the primary spongiosa (PS) zone. The secondary spongiosa zone images (c, d) show that CSD group (c) has increased disconnections and separation among the trabecular bone network and a decreased trabecular bone mass compared to the CON group (d). The arrows point the trabecular bone. Magnification of a and b, ×200; magnification of c and d, ×100. PZ proliferative zone, HZ hypertrophic zone, PS primary spongiosa zone, CSD chronic sleep deprivation, CON control