Fig. 2.

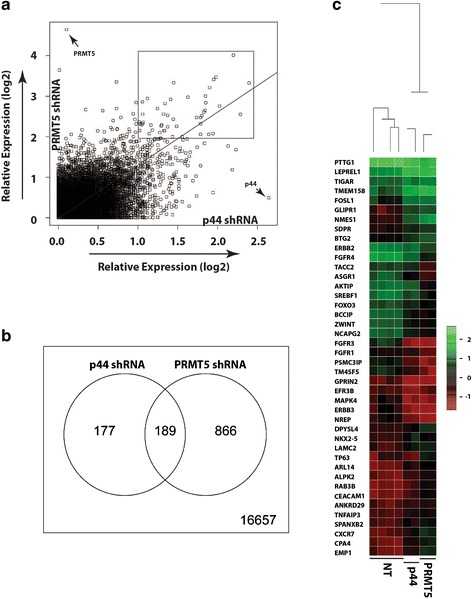
Silencing p44 or PRMT5 expression causes transcriptional deregulation of a subset of genes. a Scatter plots were performed to compare global gene expression profiles in p44- and PRMT5-silencing A549 cells. Genes whose expression altered more than 2-fold in p44 and 4-fold in PRMT5 expressing cells are circled by the rectangular box. b Venn diagram shows genes whose expression altered more than 2-fold in p44 or PRMT5 shRNA expressing cells compared to NT shRNA expressing cells. c Genes targeted by both p44 (>2-fold) and PRMT5 (>4-fold) are visualized by heatmap. The blue, black, and red colors represent higher than average, close to average, and lower than average expression of particular gene, respectively. The rows are organized by hierarchical clustering using agglomerative clustering with complete linkage and Euclidian distance metric
