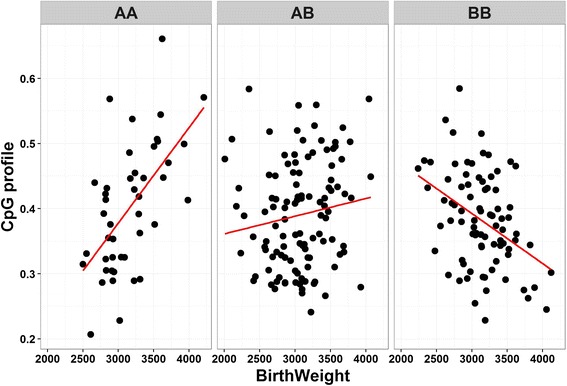
Fig. 4.

The scatter plot to display an example of methylation corresponding to the environment in different genotype groups. AA, AB and BB are pseudo codes for major allele homozygote, heterozygote and minor allele homozygote. Phenotypic values are shown on the x-axis, and methylation value in percentage on the y-axis. The straight lines fit for associations in each group
