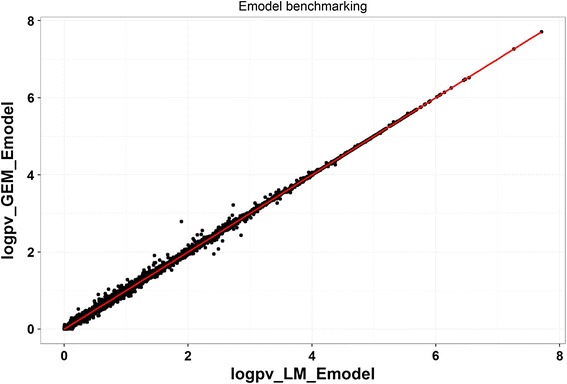
Fig. 5.

Emodel benchmarking for methylation matrix containing missing values. Pvalue was transformed as –log10. A-axis is pvalues from LM_Emodel, y-axis is from GEM_Emodel. Among ~250,000 CpGs that were tested, 18 % of them contained at least one missing values. Our results showed pvalues for CpGs without missing values are perfectly matched, while there were slightly differences between the two implementations when CpG contains missing values
