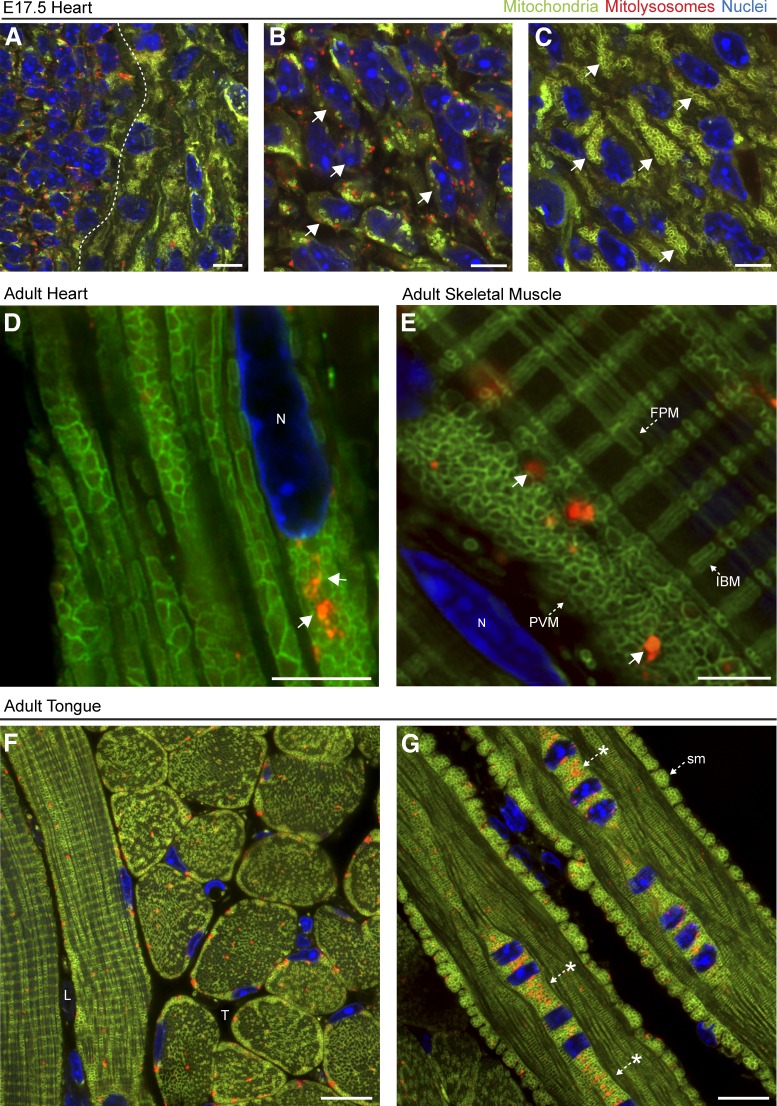
Figure 3.
Comparative overview of mitochondrial networks in developing and adult muscle tissues in vivo. (A–C) High-resolution Airyscan images of E17.5 heart. Dotted line indicates division between high and low mitophagic regions. Magnified photomicrographs of mitochondrial architecture in regions with high and low degrees of mitophagy are shown in B and C, respectively. Arrows highlight the differential organization of mitochondrial networks within cells of the same tissue. (D) High-magnification Airyscan image of adult mito-QC heart, depicting the mitochondrial architecture and the position of mitolysosomes (arrows) within ventricular cardiomyocytes in vivo. N, Nucleus. (E) High-magnification Airyscan image of a mitochondrial network depicting mitolysosomes and aspects of the recently described mitochondrial reticulum within adult skeletal muscle. Arrows indicate different muscle mitochondrial morphologies. FPM, fiber parallel mitochondria; PVM, paraventricular mitochondria; IBM, I-band mitochondria. Bars, 5 µm. (F and G) Representative images from parasagittal sections of adult tongue from a mito-QC reporter mouse. Bars, 10 µm. (F) Image shows transverse (T) and longitudinal (L) fibrils containing mitochondrial networks and mitolysosomes. (G) Image of a longitudinal tongue muscle fiber with sarcolemmal (sm) mitochondria at the periphery of the fiber and a cluster of mitolysosomes at a multinucleated orthogonal intersection (asterisks). DAPI is shown in blue throughout.

