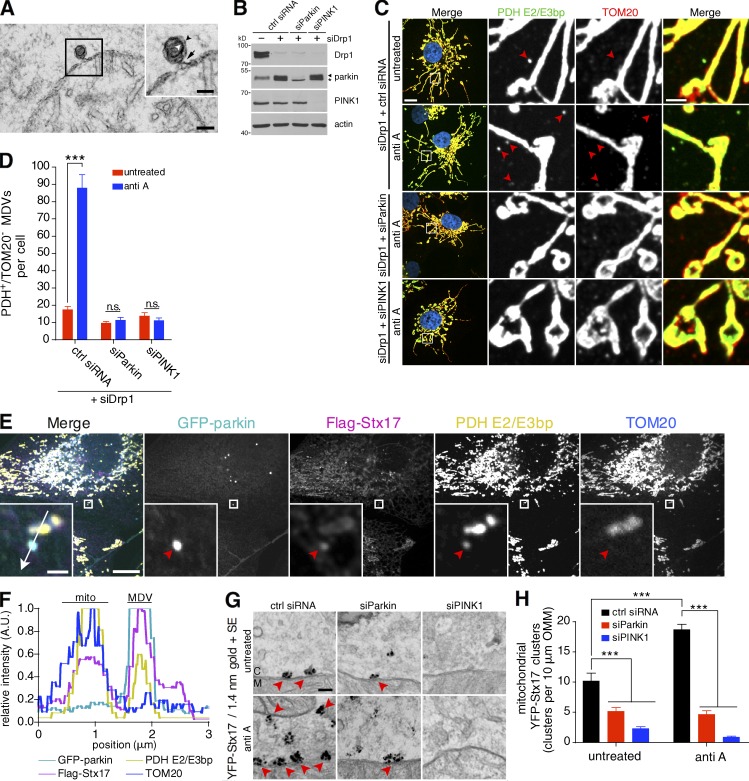
Figure 3.
Stx17 localizes to parkin/PINK1-dependent MDVs. (A) Transmission electron micrograph of a COS7 cell treated with 25 µM antimycin A for 45 min before fixation. The inset (black box) shows a budding profile connected to the mitochondrial outer membrane. White and black arrowheads indicate the inner and outer vesicular membranes, respectively, and the black arrow indicates the vesicle neck. Bars: (full image) 100 nm; (inset) 50 nm. (B) COS7 cells were transfected with the indicated siRNA and 60 µg lysate from untreated cells was separated by SDS-PAGE and immunoblotted against the indicated protein. The asterisk indicates a nonspecific band. (C) Representative confocal images of antimycin A–treated cells immunostained for PDH E2/E3bp (green) and TOM20 (red; Hoescht, blue). Selective, PDH E2/E3bp+/TOM20− structures corresponding to MDVs are indicated by red arrowheads. Bars: (left) 10 µm; (right) 2 µm. (D) Quantification of the number of PDH E2/E3bp+/TOM20− MDVs per cell in cells from C treated with or without 25 µM antimycin A for 45 min. Bars represent mean ± SEM, n = 23–29 cells per condition. ***, P < 0.001; n.s., not significant. (E) Confocal image of a U2OS:GFP-parkin (cyan) cell, expressing Flag-Stx17 (magenta), treated with 25 µM antimycin A for 2 h, fixed and immunostained against PDH E2/E3bp (yellow) and TOM20 (blue). Red arrowheads in the insets indicate a PDH E2/E3bp+/TOM20− structure colocalizing with GFP-parkin and Flag-Stx17. Bars: (full image) 10 µm; (insets) 1 µm. (F) Intensity plot through the 3-µm line drawn in the merged inset in E. The MDV indicated in E, as well as a mitochondrion (mito), are indicated. A.U., arbitrary units. (G) Representative transmission electron micrographs of COS7 cells, transfected with control siRNA (ctrl siRNA) or siRNA targeting parkin (siParkin) or PINK1 (siPINK1), expressing YFP-Stx17, immunostained against YFP, and labeled with 1.4 nm gold particles and silver enhanced (SE). Cells were treated with 25 µM antimycin A for 45 min or left untreated before fixation. Red arrowheads indicate clusters of YFP-Stx17 signal. M, mitochondrion; C, cytosol. Bar, 100 nm. (H) Quantification of the number of YFP-positive foci per distance of mitochondrial outer membrane, in antimycin A–treated and untreated cells expressing YFP-Stx17, in cells from G. Bars represent mean ± SEM; n = 105–207 mitochondria per condition; ***, P < 0.001.

