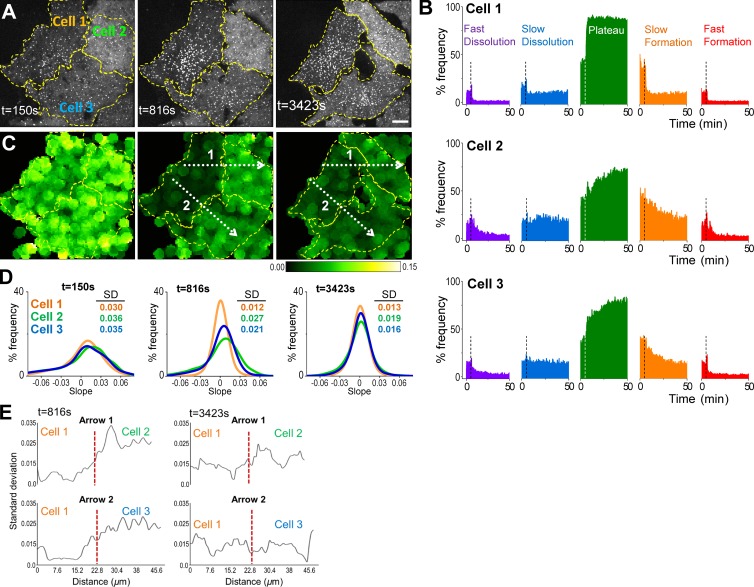
Figure 5.
Real-time monitoring of CCS dynamics in cholesterol-depleted cells. (A) Fluorescence images show snapshots of three BSC-1 cells stably expressing AP2-GFP. 10 mM MβCD was applied at the sixth minute (t = 360 s) to initiate cholesterol depletion (Video 2). Dashed lines demarcate the cell boundaries. Bar, 10 µm. (B) For the three cells shown in A, percentage frequency of the five growth phases are plotted as a function of time. The dashed lines denote the time point of MβCD addition. The fastest change in CCS dynamics is observed in cell 1. (C) Figures show standard deviation (of local clathrin growth rates for the snapshots shown in A. Each pixel in the image is given the value of standard deviation of the growth rates detected from CCSs found in a radius of 4.8 µm. This representation is used for illustrating temporal and spatial variations in CCS dynamics. Standard deviation is lower in regions where the growth rate distribution is narrow, a signature of impeded CCS dynamics. Cell 1 responds to cholesterol depletion the earliest, as observed at t = 816 s. (D) Growth rate histograms are shown for the three cells at the time points of the snapshots in A and C. Spatial and temporal heterogeneity of CCS dynamics can be detected using the standard deviation of growth rate histograms, which change at different rates for the three cells. (E) Plots show spatial variation in standard deviation of local CCS growth rates over the distances shown by the dashed arrows in C. Positions of the cell boundaries are marked by the dashed red lines.

