
Fig. 2.
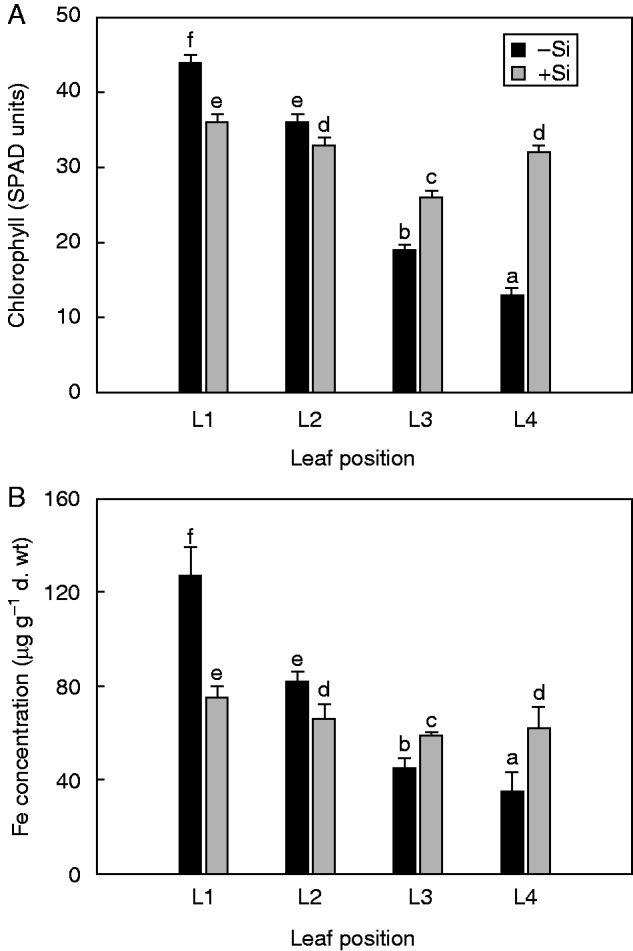
Effect of Si supply on spectral plant analysis diagnostic (SPAD) readings (A) and Fe concentration (B) in cucumber leaves at different positions. Leaf positions (from the base to the youngest leaf): L1, L2, L3 and L4. Iron-deprived 7-day-old plants were treated with 10 μm Fe for 3 d and then transferred to an Fe-free nutrient solution with or without supply of 1·5 mm Si(OH)4 for 11 d. Data shown are means ± s.d. (n = 4). Significant differences (P < 0·05) between treatments are indicated by different letters.