
Fig. 3.
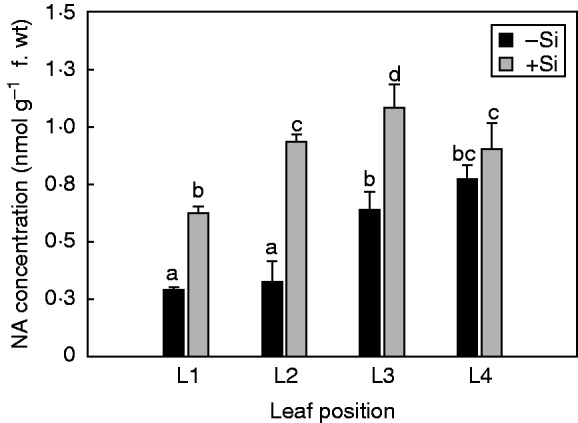
Effect of Si supply on the total nicotianamine (NA) concentration in cucumber leaves at different positions. Leaf positions (from the base to the youngest leaf): L1, L2, L3 and L4. The plants were treated as described in the legend of Fig. 2. Data shown are means ± s.d. (n = 4). Significant differences (P < 0·05) between treatments are indicated by different letters.