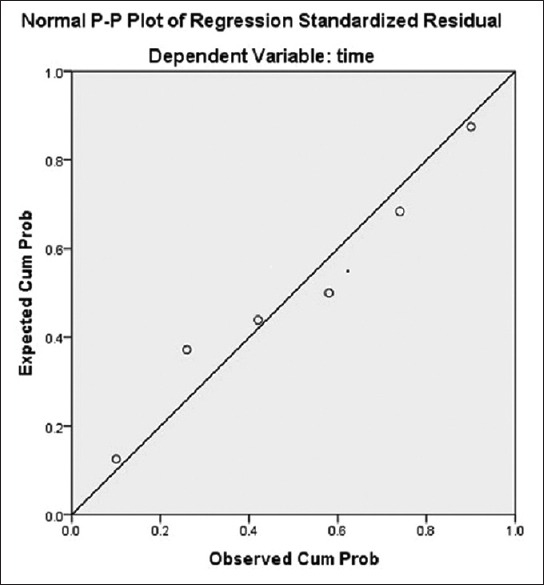
Figure 6.

The regression line is close to the observed value which shows there was a strong correlation and regression between the time intervals and appearance of the histological changes

The regression line is close to the observed value which shows there was a strong correlation and regression between the time intervals and appearance of the histological changes