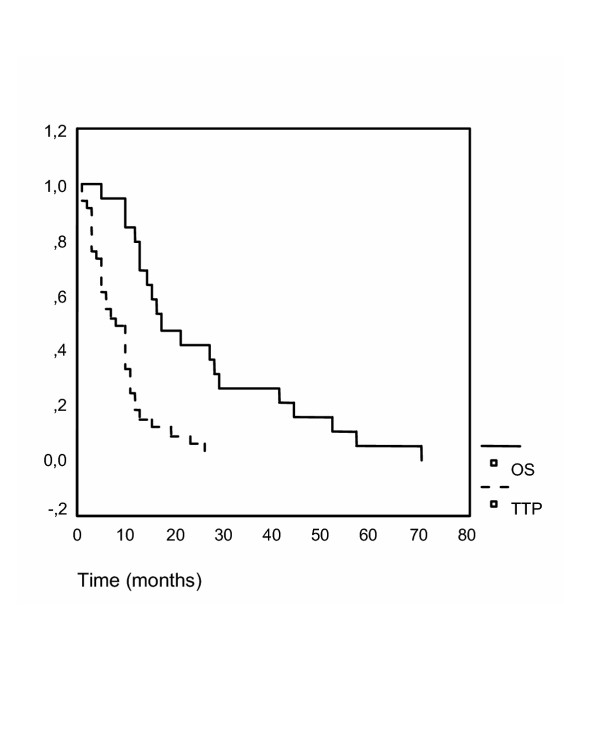
Figure 1.

Overall survival. The time to progression (TTP) and overall survival (OS, in months) are plotted as Kaplan-Meier-curves. Overall survival is drawn as a continuous line, total progression free survival as a dotted curve. TTP and OS were 7 and 17 months, respectively.
