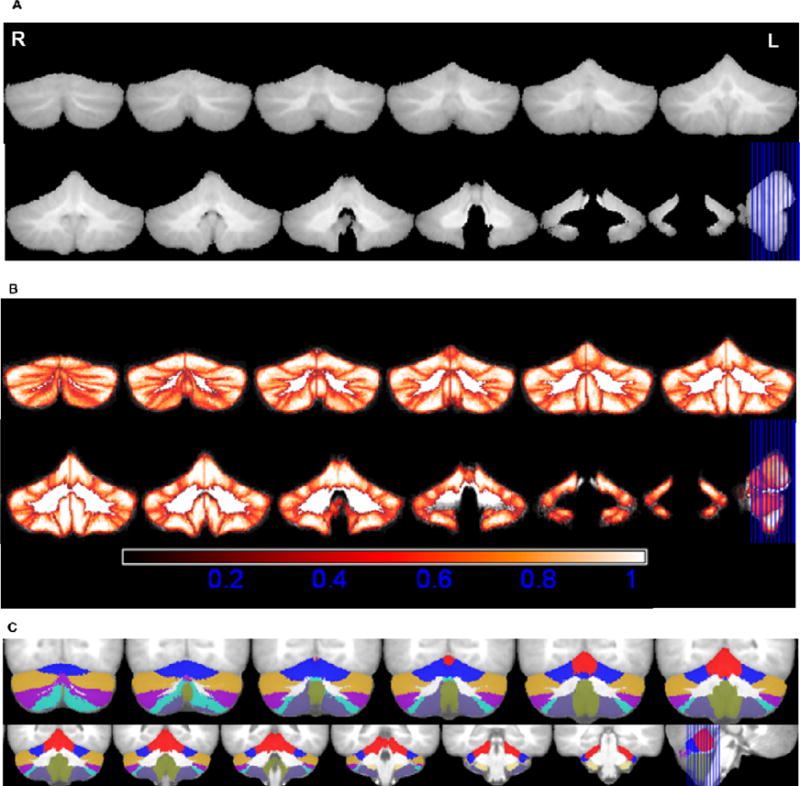
Fig. 3.

A. Average cerebellar image in normalised space, R-Right, L-Left; B. Maximum Probability maps of individual structures; bright colors (white) indicate voxels with high probability and darker (red) colors indicate voxels with lower probability. C.Maximum likelihood labellings superimposed on the average image generated after spatial normalization with the NIHPD (7.5–13.5 years) asymmetric template. The colors represent the lobules of the cerebellum as per the color look up table in Figure 2. The coronal slices range from MNI coordinates −75 to −33.
