
Fig. 5.
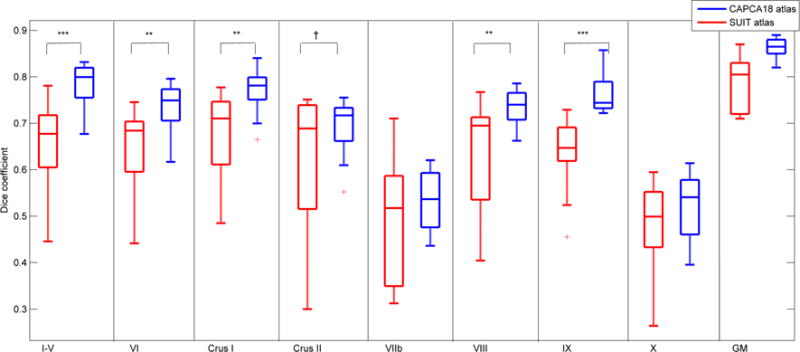
Box-and-whisker plots of Dice coefficients that quantify spatial overlap in 14 test subjects of manual tracing with automatic segmentation using either the SUIT (red) or CAPCA18 (blue) atlases for eight whole lobules and total cerebellar gray matter (GM). †p<0.1; *p<0.05; **p<0.01; ***p<0.001