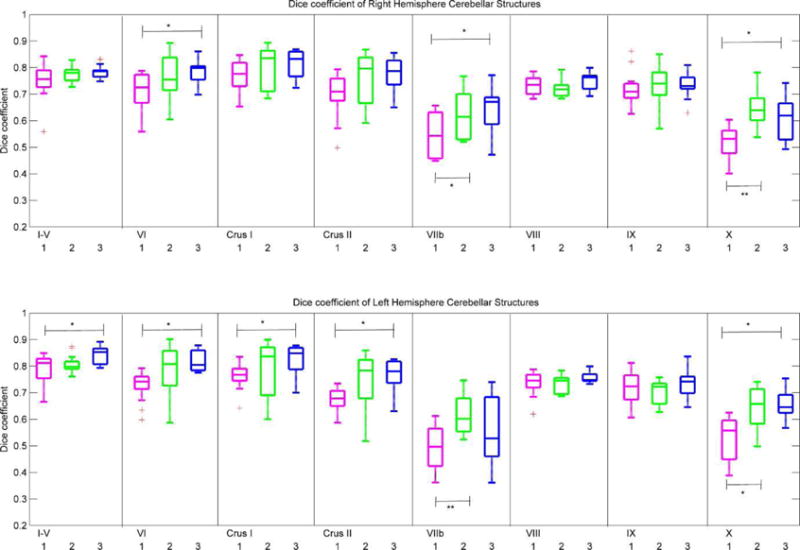
Fig. 6.

Box-and-whisker plots of Dice coefficients in the right hemisphere (top row) and left hemisphere (bottom row) that quantify spatial overlap in 14 test subjects of manual tracing with each of three automated segmentation strategies, (1): CAPCA18 probabilistic atlas based segmentation (magenta); (2): multi atlas majority voting (MAMV; green); (3): multi atlas generative model (MAGM; blue). †p<0.1; *p<0.05; **p<0.01; ***p<0.001.
