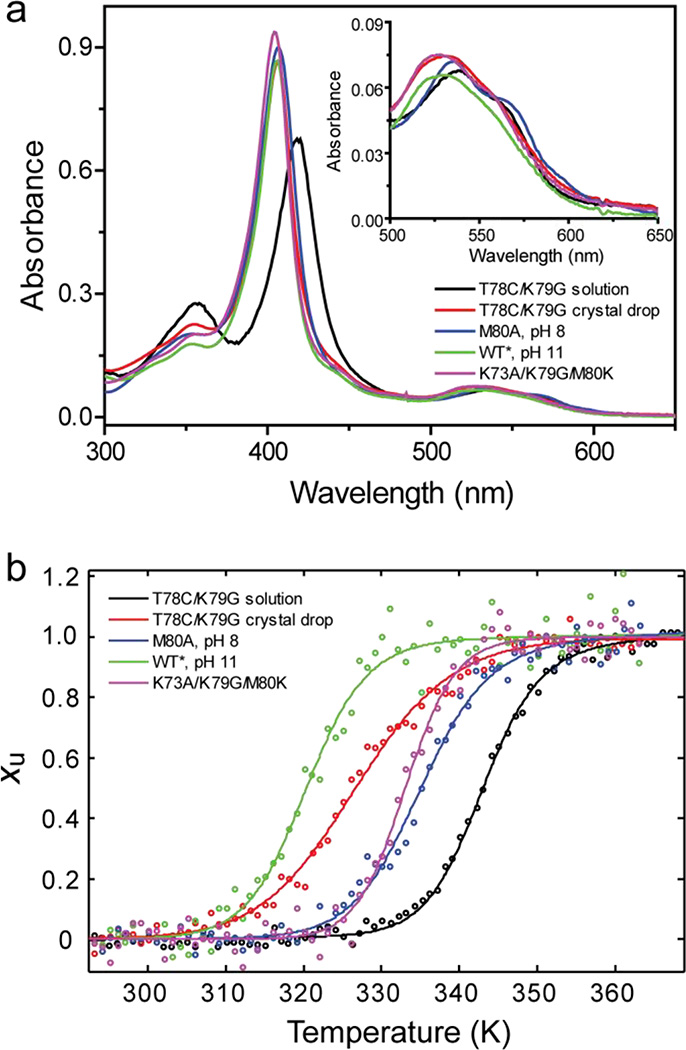
Figure 3.
(a) UV-visible spectra and (b) thermal unfolding curves (fraction of unfolded protein Xu versus temperature) from CD measurements are shown for ferric T78C/K79G in solution (black) and recovered from crystal drops (red) as well as K73A/K79G/M80K (magenta) at pH 7.4, M80A at pH 8 (blue), WT* at pH 11 (green). The inset in (a) illustrates different features of Q-bands for the five samples.

