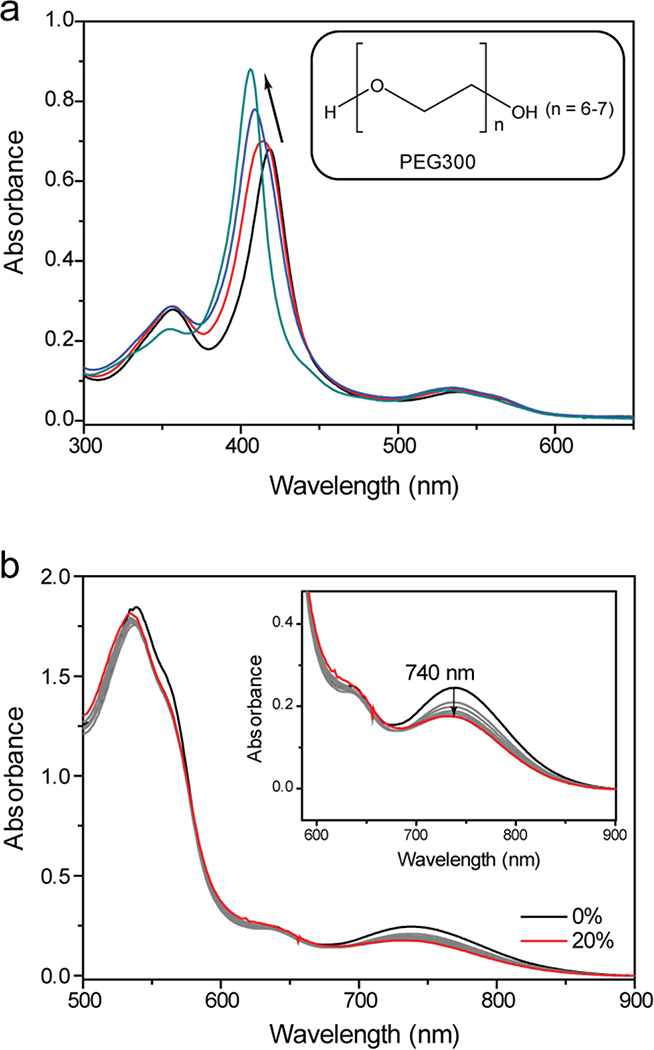
Figure 4.
(a) Changes in the UV-visible spectra of T78C/K79G during crystal growth: shown are spectra (upon dilution, see Materials and Methods) at the start of crystallization (black), the next day (red), after one week (blue), and after two weeks, when crystals became clearly visible (teal). Inset: Structure of polyethylene glycol 300 (PEG300). (b) Visible and near-IR (inset) spectra of T78C/K79G at different concentrations of PEG300 (from 0 to 20% v/v) added to a 100 mM sodium phosphate buffer at pH 7.4.

