
Figure 2.
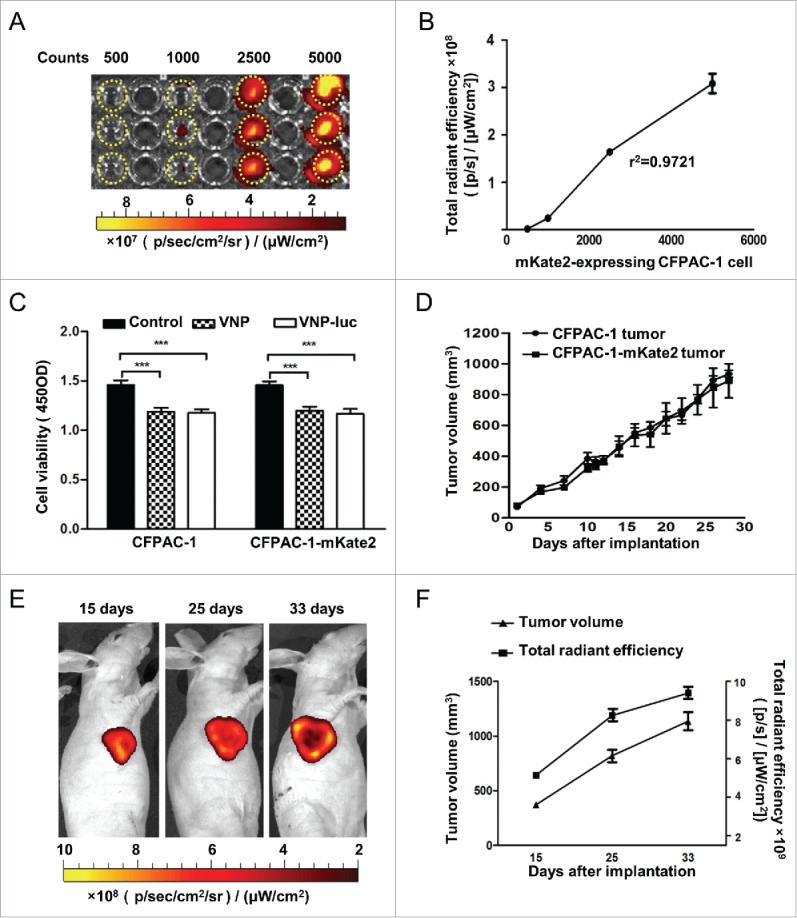
Characterization of mKate2-expressing CFPAC-1 cells in vitro and in vivo. (A, B) The mKate2-expressing CFPAC-1 cells were plated at different densities (500–5,000 cells) in 96-well plates, and fluorescence signals were measured with IVIS Spectrum Imaging System (r2 = 0.97), dotted circles indicated the wells with CFPAC-1-mKate-2 cells. (C) Cell viability was analyzed by CCK8 assay after the CFPAC-1 and CFPAC-1-mKate2 cells were co-cultured with VNP20009 or VNP200009-luc for 48 h, ***P < 0.001. (D) The growth rate of subcutaneous tumors of the parental CFPAC-1 and mKate2-expressing cells were measured. Bars, mean ± SEM. (E) The mKate2-expressing CFPAC-1 cells were implanted in nude mice and the mKate2 fluorescent signal was measured on day 15, 25 and 33 after injection. Representative images are shown. (F) The tumor volumes and the corresponding total radiant efficiency were measured. Bars, mean ± SEM. VNP and VNP-luc are abbreviations for VNP20009 and VNP20009-luc.