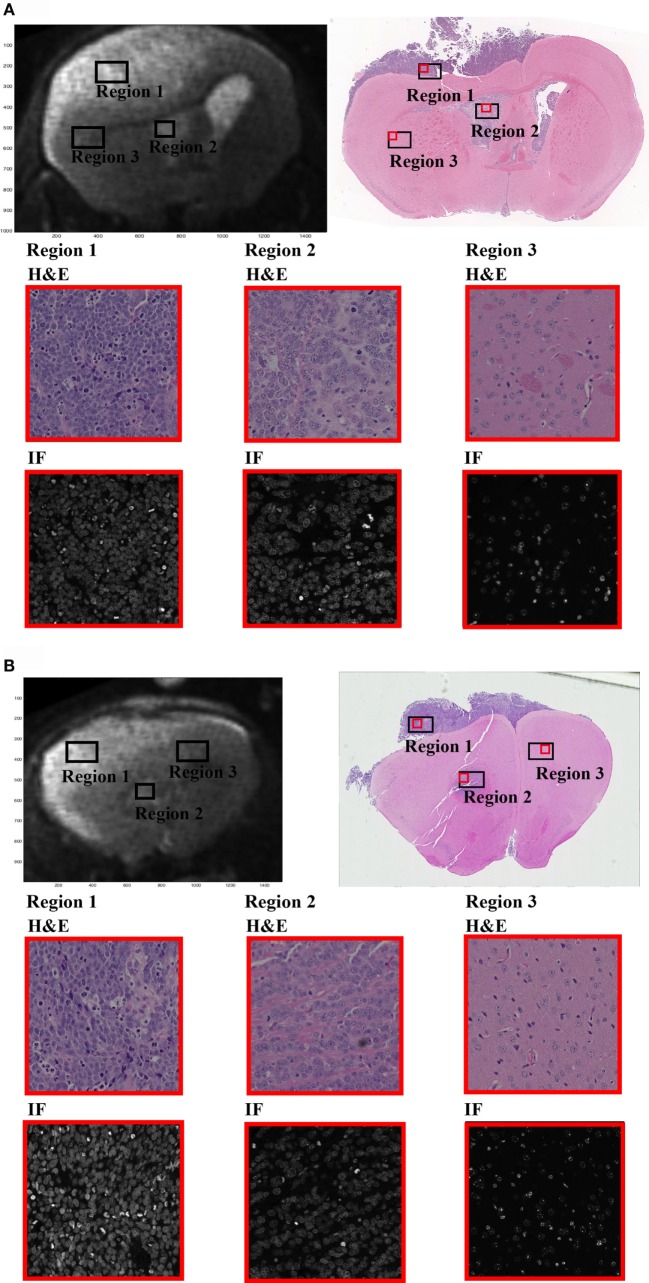
Figure 1.
In the presented study, we have investigated the diffusion time (Δ)-dependence on the DW-signal within three regions of interest (ROIs) selected from MRI brain images of a single GBM xenograft mouse. (A,B) Display the two MRI slices selected for the study (upper left) along with the corresponding H&E-stained sections (upper right). Region 1 represents the region of high tumor cell density (nuclei coverage ~50%), region 2 of intermediate tumor cell density from within the ventricles (near injection site, nuclei coverage ~35%), and region 3 of normal-appearing brain tissue (nuclei coverage ~10%). Rows 2 and 3 of the figure show 20× magnified sections from within each ROI (red box on the full H&E image). H&E sections are displayed on row 2 and DAPI stained sections on row 3. The ROIs were carefully selected from relevant regions of the brain, and the magnification clearly demonstrates the difference in cellular density between each ROI. Note that the MRIs and the histological slides are not coregistered, only adjusted geometrically and resliced accordingly. The ROIs extracted from the histological slides do not represent a 1:1 selection of regions between the two. Hence, the histological slides are not used for qualitative measurements in the study, and the regions should only be viewed as a quantitative verification based on relative measurements.

