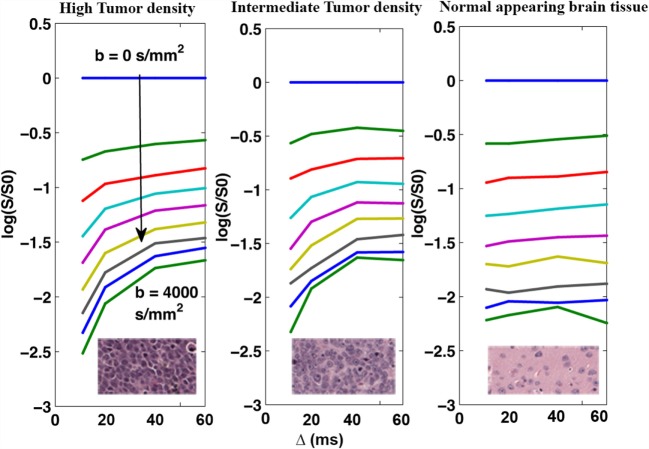
Figure 2.
Mean DW-signal as a function of Δ for the three tissue regions averaged across the two MRI slices. The DW-signal (plotted on log scale) from both the primary tumor site with high cell density (left) and the intermediate region with intermediate cell density (middle) demonstrate strong dependence on Δ, with 140% increase in signal intensity over the range of 10–60 ms.

