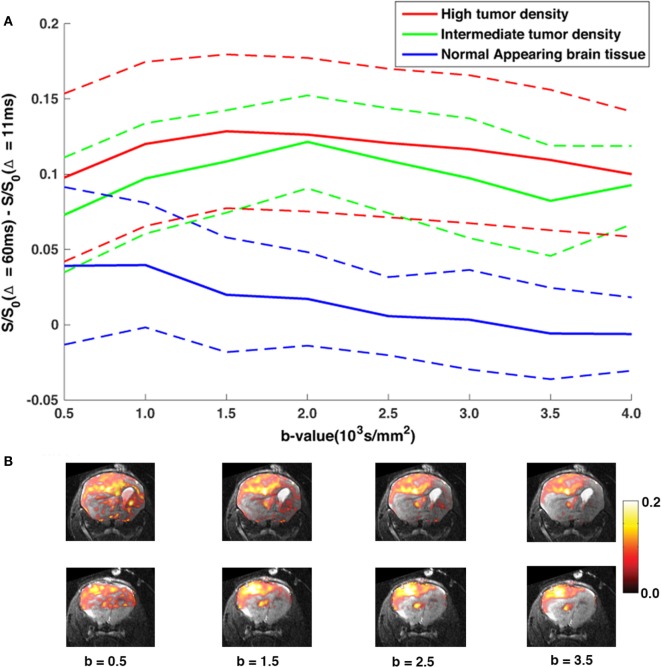
Figure 3.
The DTD contrast with increasing b-value. (A) The average DTD contrast (solid lines) as a function of b-value for each ROI, averaged across both MR slices, with corresponding SD (dashed lines) (B) DTD-maps overlaid T2,high images of two MRI slices analyzed in the study as a function of b-value. As predicted, the contrast between the NAB regions and tumor regions is weighted by the amount of restricted diffusion in the diffusion signal, and our results show that, at b > 1500 s/mm2, tumor tissue signal is well separated from the NAB signal and remains constant with increasing diffusion weighing, even within regions with lower tumor cell densities.

