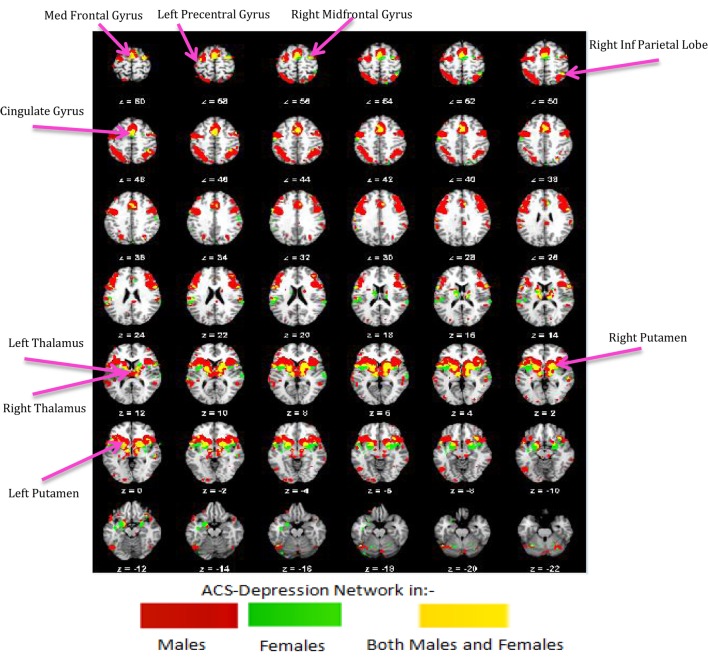
Figure 6.
ACS–depression network, which was obtained separately in males and females, is overlaid on a single anatomical image. Green represents the ACS–depression network in females, red in males, and yellow represents their overlap. Only regions of overlap are labeled in the figure while Table 5 provides labels of regions, which were exclusively coactivated with ACS–depression network seeds only in males and females.

