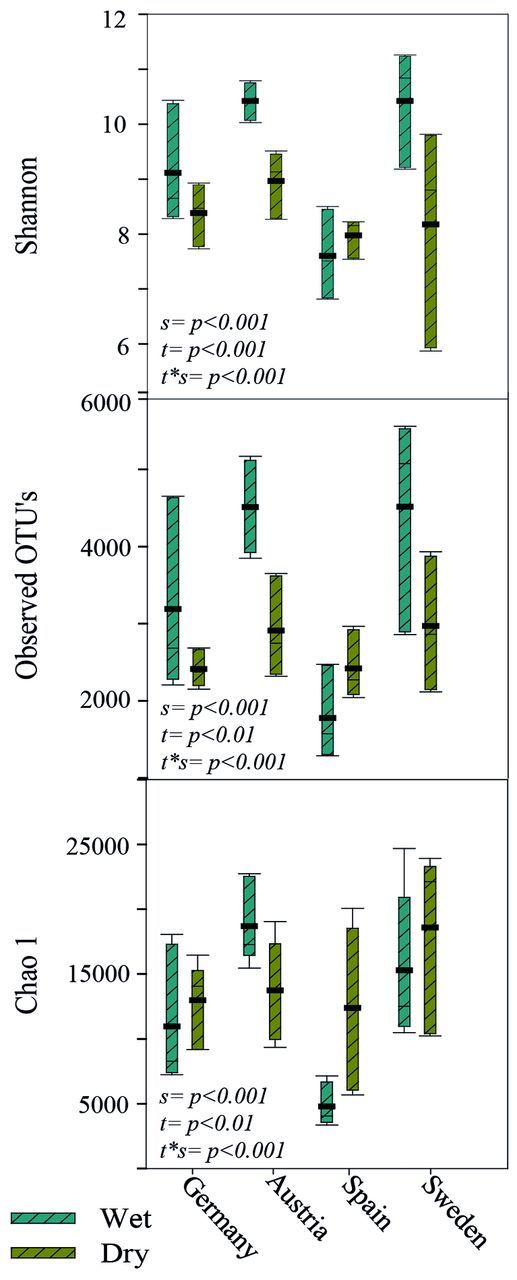
Figure 5.

Cyanobacterial richness and diversity estimates, based on 10 000 sequences per sample, calculated for the different sites. ▄ = mean. P values represent a two-way ANOVA analysis and significant differences based on: s = site, t = treatment and t*s = treatment*site.
