Figure 1.
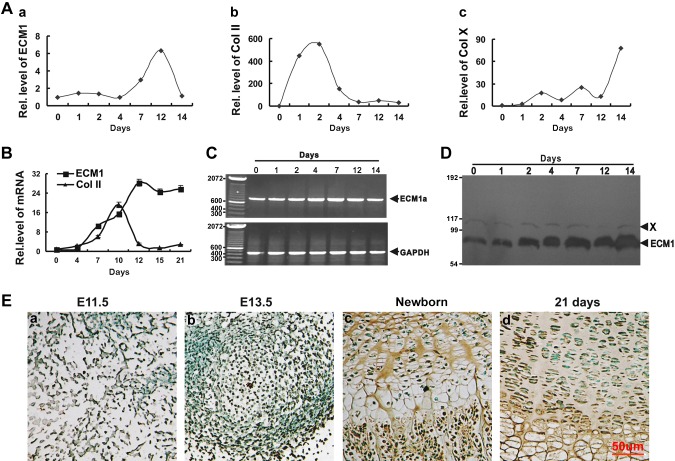
Expression of ECM1 in the course of chondrogenesis in vitro and in the growth plate chondrocytes in vivo. A) Expression of ECM1 (a), Col II (b), and Col X (c) in the course of chondrogenesis of a micromass culture of C3H10T1/2 cells assayed by real-time PCR. Experiments were carried out in biologic replicates (n = 3). B) Differential expression of ECM1 during chondrogenesis of a pellet culture of hMSCs assayed by real-time PCR. Experiments were carried out in biologic replicates (n = 3). C) Specific expression of ECM1a isoform, but not 1b or 1c, in the course of chondrogenesis, evaluated by PCR assay. C3H10T1/2 cells were cultured as described for panel A, and ECM1a was detected via PCR and confirmed by sequence analysis. D) Levels of ECM1 and internal control (nonspecific protein, labeled X) during chondrogenesis were detected by using Western blot. The process was the same as for panel A. E) Temporal and spatial expression of ECM1 during chondrogenesis in vivo assayed by immunohistochemistry. Sections of long bone from various embryonic and postnatal developmental stages of mice (a, E11.5; b, E13.5; c, newborn; d, 21-d-old mice) were stained with anti-ECM1 antiserum (brown) and counterstained with methyl green (green). Immunostaining revealed positive cytoplasmic staining in and around chondrocytes. Each experiment was repeated ≥3 times. Units are arbitrary and normalized values were calibrated against controls, here given the value of 1. Rel. level, relative level.

