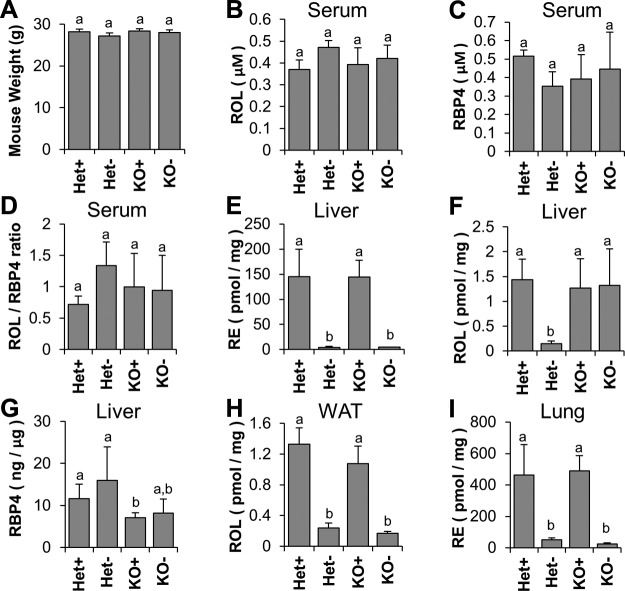
Figure 2.
Effects of 12 wk of VAS and VAD dietary regimens on Het and KO mice. A) Mouse weights at end of study; B) HPLC measurements of serum ROL; C) ELISA measurement of serum RBP4; D) Serum ROL:RBP4 ratio; E) HPLC measurements of RE in liver; F) HPLC measurements of ROL in liver; G) ELISA measurements of RBP4 in liver; H) HPLC measurements of ROL in WAT; and I) HPLC measurements of ROL in lung. Letters shared between groups indicate no significant difference. Statistical significance was tested by applying a Student’s t test to each group compared with each other group. Data present values from n = 6 per genotype and dietary condition.

