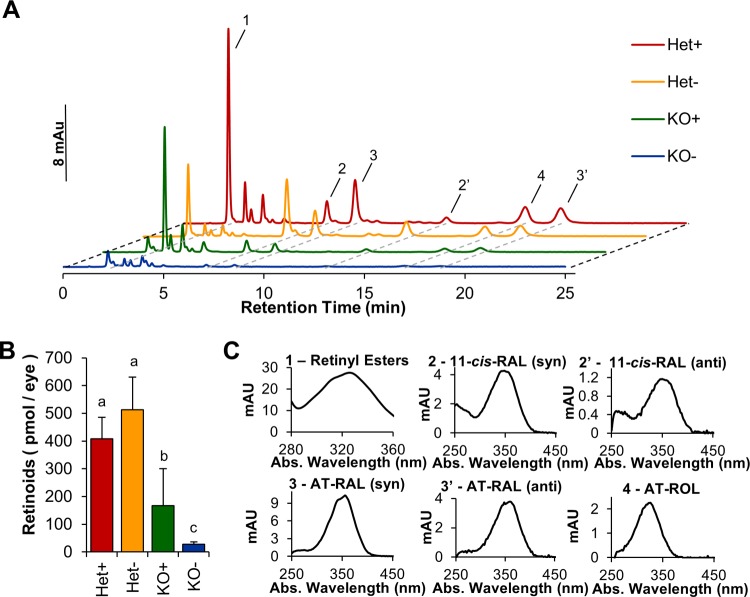
Figure 3.
Ocular vitamin A levels are affected by both genotype and diet. Comparison of ocular retinoid composition of Het and KO mice raised on VAS and VAD dietary regimens. A) Typical HPLC traces showing peaks for 1, REs; 2, 11-cis-retinal [11-cis-RAL (syn)]; 2′, 11-cis-RAL (anti); 3, all-trans-retinal (AT-RAL) (syn); 3′, AT-RAL (anti); 4, ROL. Red trace, Het+ mice; orange trace, Het− mice; green trace, KO+ mice; blue trace, KO− mice. B) Total ocular retinoids at the end of study of different genotypes and dietary regimens. C) Spectral characteristics of different retinoids detected in panel A. Letters shared between groups indicate no significant difference. Statistical significance was tested by applying a Student’s t test to each group compared with each other group. Data present values from n = 6 per genotype and dietary condition.

