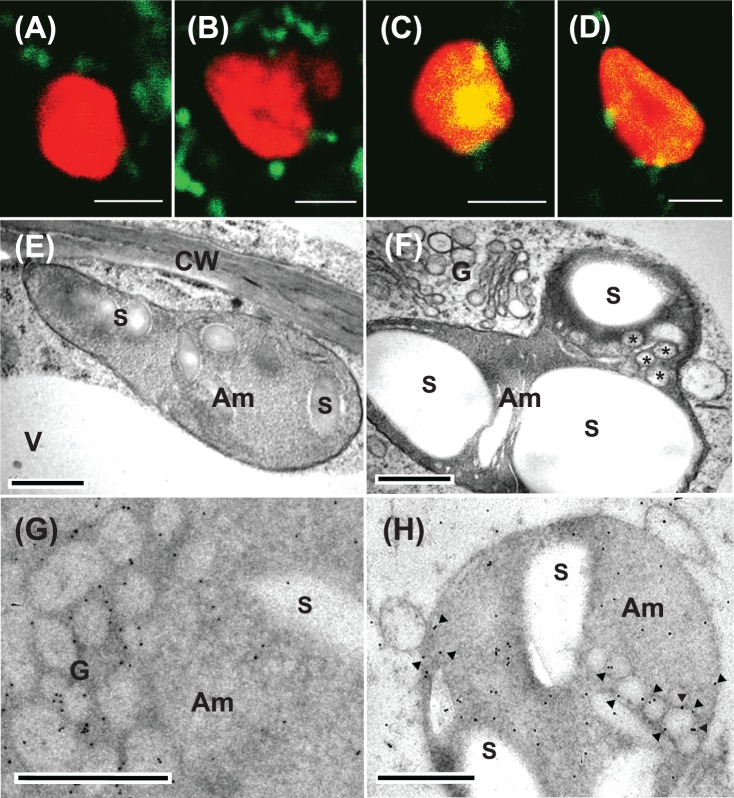
Fig. 4.
Confocal imaging and electron microscopy characterization of trans-Golgi to plastid communication in rice cells expressing ST–GFP without or with a constitutively high expression of NPP1. (A–D) The stable transformant rice cells were sectioned with a vibratome to 25μm thickness, and immediately observed by means of confocal laser scanning microscopy. (A and B) Rice cells expressing ST–GFP without NPP1 overexpression. (C and D) Rice cells expressing ST–GFP with NPP1. GFP (green) and Chl autofluorescence (red) merged. Some Golgi marker ST–GFP complexes (green blobs) were tightly adhered to the surface of chloroplasts. The change in color from red to yellow in the interior of the plastid is due to the uptake of ST–GFP. Scale bars represent 2μm. (E–H) The rice cells cultured in MS medium containing 3% sucrose were rapidly frozen in a high-pressure freezer and subjected to electron microscopic studies. Am, amyloplasts; CW, cell wall; G, Golgi; V, vacuole; S, starch. (E and F) Morphological observations of the cells expressing ST–GFP without and with NPP1 overexpression, respectively. Asterisks represent small membrane vesicles observed in the plastid. (G and H) Immunocytochemical observations with anti-GFP antibodies of the cells expressing ST–GFP with NPP1 overexpression. (G) shows remakable labeling of immunogold particles in the Golgi vesicle area. Arrowheads in (H) show immunogold particles deposited on membrane vesicles inside plastids. Scale bars represent 0.5μm.

