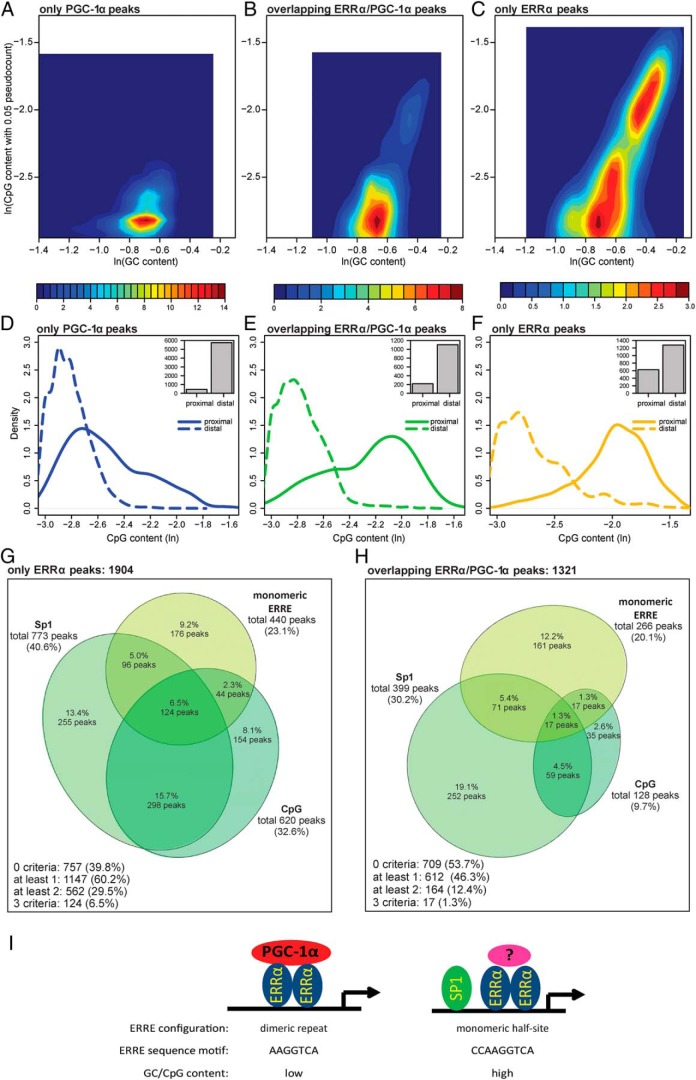
Figure 6. Only ERRα peaks prefer to occur as ERRE monomers and to bind high CpG content regions A–C, Two-dimensional histogram (shown as a heat map) of the GC base content (horizontal axis) and CpG dinucleotide content (vertical axis) of only PGC-1α (A), overlapping ERRα/PGC-1α (B), and only ERRα peaks (C).
The values shown on both axes are expressed as logarithms. D–F, Density plots of the CpG content of only ERRα (D), overlapping ERRα/PGC-1α (E), and only PGC-1α (F) peaks, located either proximally (≤1 kb) or distally (>1 kb) from the closest promoter. Each inset shows the bar plot of the number of proximal and distal peaks. G and H, Euler diagram of only ERRα peaks (G) and of overlapping ERRα/PGC-1α peaks (H). Peaks were subdivided according to 3 different criteria: presence of SP1-binding sites, presence of monomers and high CpG content (defined as GC content ≥ 50% and CpG content ≥ 65%). I, Model of ERRα regulation of PGC-1α target genes in muscle cells. A combination of SP1 corecruitment, monomeric vs dimeric ERRα-binding site configuration, nucleotide preference of the ERRE, and GC/CpG content affect coactivation of ERRα by PGC-1α in the regulation of PGC-1α target genes in muscle cells.

