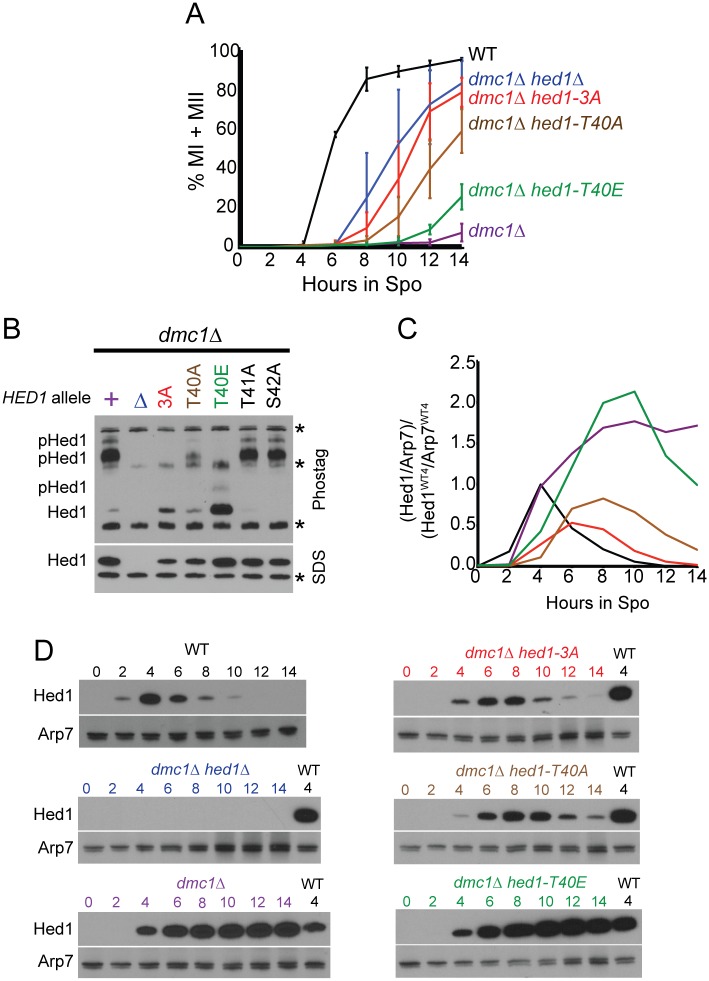
Fig 3. Negative charges in the Hed1 T40 region promote Hed1 function in the absence of DMC1.
(A) Meiotic progression. Wild-type (NH716), dmc1Δ (NH942::pNH3022), dmc1Δ hed1Δ (NH942/pRS316), dmc1Δ hed1-3A (NH942::pNH302-3A2), dmc1Δ hed1-T40A (NH942::pNH302-T40A2) and dmc1Δ hed1-T40E (NH942::pNH302-T40E2) diploids were transferred to Spo medium at 30°C, fixed at various time points, stained with DAPI and the number of nuclei determined using fluorescence microscopy. Bi-nucleate cells have completed MI and tetra-nucleate cells have completed MII. Meiotic progression was plotted as the average % MI + MII from multiple timecourses. Error bars indicate the standard deviations between experiments. For WT, n = 3; dmc1Δ, n = 8, dmc1Δ hed1Δ, n = 10; dmc1Δ hed1-3A, n = 8; dmc1Δ hed1-T40A, n = 9, dmc1Δ hed1-T40E, n = 5. The color code shown in Panel A is used throughout the paper. The data used for all of the graphs in this paper are contained in S1 Data. (B) Mobility shift of different Hed1 mutant proteins. The dmc1Δ hed1Δ diploid, NH942, carrying either vector alone (Δ) or two copies of pNH302 (URA3 HED1) or its indicated derivatives was transferred to Spo medium for 4 hr. Extracts were fractionated on 10% SDS-polyacrylamide gels with 75 μM Phostag and 75 μM MnCl2 (top) or without Phostag (bottom), transferred to membranes and probed with α-Hed1 antibodies. “Hed1” indicates the non-phosphorylated protein, while “p-Hed1” indicates phosphorylated Hed1. Asterisks indicate non-specific bands. (C) Quantification of Hed1 protein levels the timecourses shown in Panel D. After the proteins were transferred, the membrane was cut horizontally and the bottom half was probed with α-Hed1 while the top was probed with Arp7. For each sample, the Hed1 protein was normalized to the Arp7 from that lane. For comparison between different blots, extract from the 4 hr WT timecourse (Hed1WT4) was included with each timecourse and each Hed1/Arp7 ratio was then divided by the Hed1WT4/Arp7WT4 ratio from that gel. (D) Protein extracts from one of the set of timecourses shown in Panel A were probed with α-Hed1 or α-Arp7 antibodies. This experiment was repeated twice with similar results.

