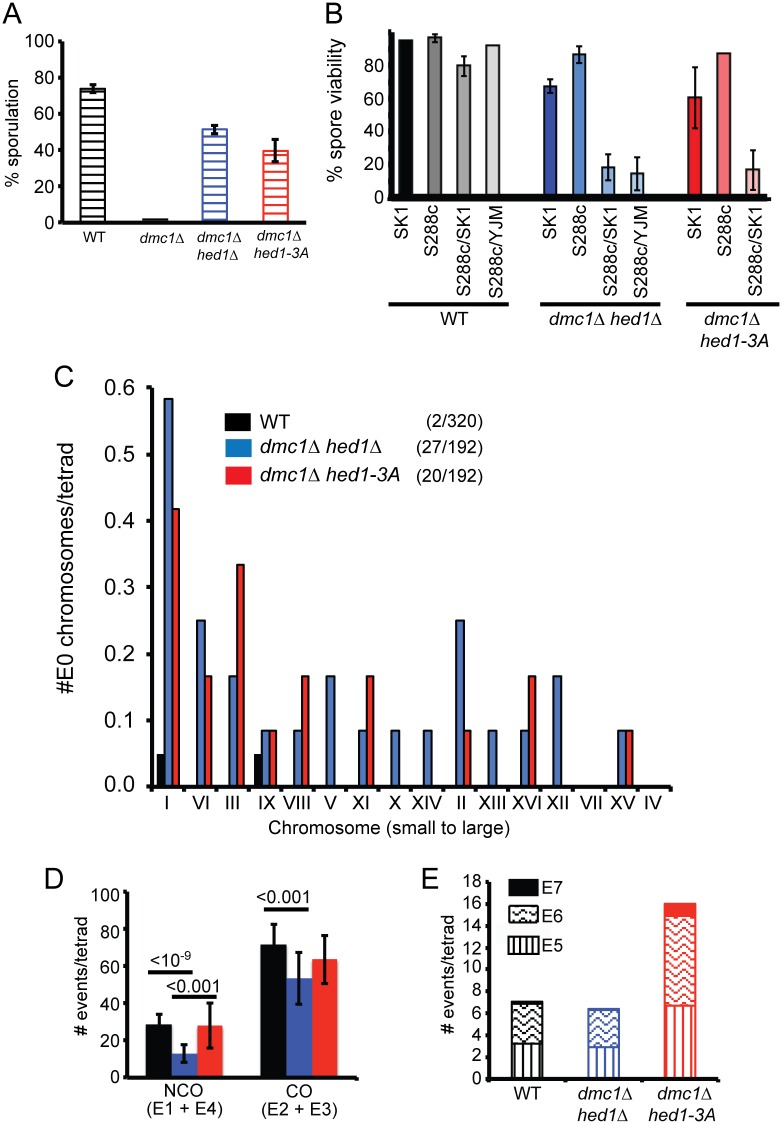
Fig 6. Rad51-mediated recombination in hybrid strains determined by Next Generation Sequencing of tetrads.
(A) WT (AND1702), dmc1Δ (NH2310), dmc1Δ hed1Δ (NH2294) and dmc1Δ hed1-3A (NH2294::pNH302-3A2) SK1/S288c hybrid diploids were sporulated on plates for three days at 30°C and five independent colonies were assayed for the percent asci measured by light microscopy. 200 cells were counted for each colony. Error bars represent the standard deviations. (B) Spore viability was measured by dissecting a total of 93–104 tetrads. SK1 (NH716), S288c (NH2315/pRS316); SK1/S288c (AND1702), YJM789/S288c (NH1053); dmc1Δ hed1Δ: SK1 (NH942), S288c (NH2320/pRS316), SK1/S288c (NH2294), YJM789/S288c (NH2032) and dmc1Δ hed1-3A: SK1 (NH942::pNH302-3A2), S288c (NH2320::pNH302-3A2), SK1/S288c (NH2294::pNH302-3A2). Error bars represent the standard deviations obtained by dissection of different colonies (n = 4). (C) Distribution of non-exchange (E0) chromosomes as a function of chromosome size as determined by NGS of SK1/S288c diploids (20 tetrads for WT and 12 tetrads each for dmc1Δ hed1Δ and dmc1Δ hed1-3A). The absence of a bar indicates that all of the chromosomes for that strain had at least one CO. Numbers in parentheses indicate the number of E0 chromosomes/total number of chromosomes. Dot plots showing the distribution of E0 chromosomes in each tetrad can be found in S3 Fig. (D) Comparison of NCO and CO events/tetrad. The total number of COs (E2 + E3)/tetrad or NCOs (E1+E4)/tetrad was plotted for each genotype. Error bars indicate standard deviation between tetrads. Lines indicate statistically significant differences with the p values calculated using a two-tailed t-test. (E) Comparison of minority event types. The average number of E5, E6 and E7 events per tetrad for each genotype is indicated. Asterisks indicate values that are statistically significantly different from both WT and dmc1Δ hed1Δ (calculated using a two-tailed t-test). No significant differences were observed for any minority event type between WT and dmc1Δ hed1Δ. p values can be found in S1 Data.

