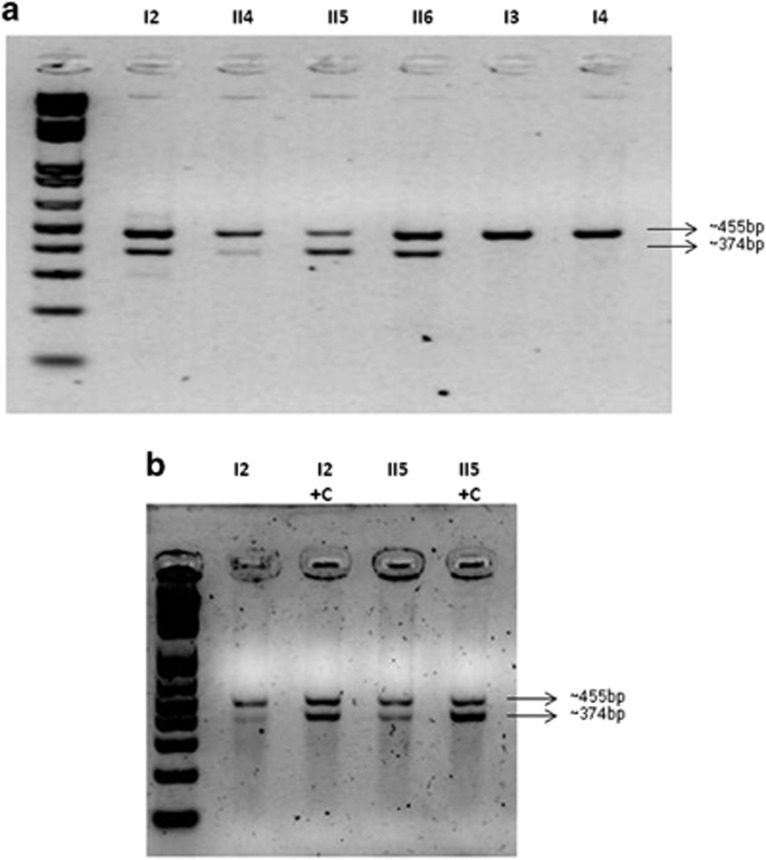
Figure 3.
Analysis of IQSEC2 cDNA. The amplified products encompassing exons 10–13 are shown. (a) The first six bands correspond to mRNA IQSEC2 products obtained from lymphocytes. Two bands were visualized in mutation carrier samples, whereas only one band was visualized in samples from healthy relatives. The first column corresponds to 1 kb plus DNA ladder. Note the different intensity patterns of the bands in the patients. (b) Amplification pattern in mRNA from fibroblasts from patients I2 and II5. +C indicates pretreatment with cycloheximide.

