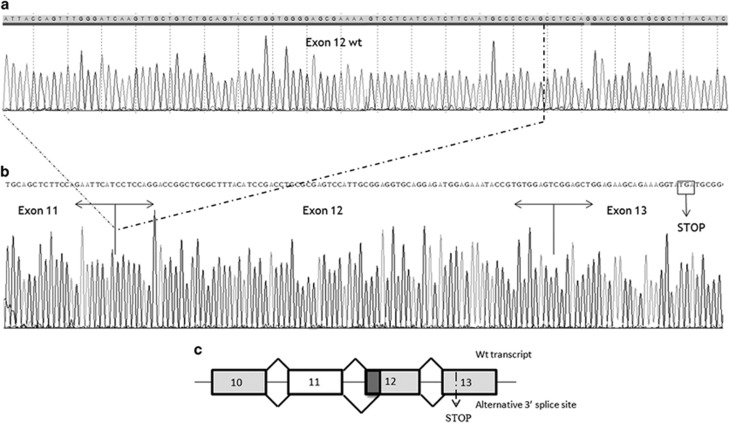
Figure 4.
The top panel (a) shows an IQSEC2 wild-type PCR product in which the normal exon structure from exons 10–13 is maintained. The bottom panel (b) shows the isolated 374-bp PCR product that corresponds to the aberrant spliced form in which 79 nucleotides of exon 12 are deleted. (c) The splicing patterns identified in the patients are represented schematically. Exons and introns are indicated by boxes and horizontal lines, respectively. The diagonal lines indicate the splicing events that were observed in lymphocytes and fibroblasts. The figure is not drawn to scale.

