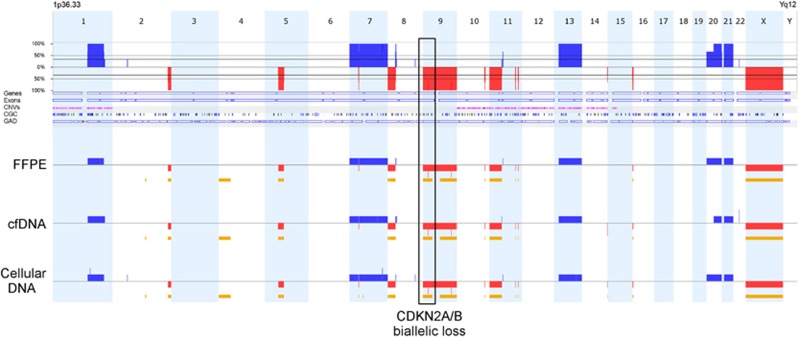
Figure 1.
Example of genomic profiles from DNAs extracted from FFPE and cellular and cfDNA from the urine from patient 23 with a stage G2 pT1 NMIBC. Comparison of profiles shows consistent aberrations identified in all three samples (red=loss, blue=gain and yellow=LOH). Aberrations from all three sources show homozygous loss at 9p21.3 including CDKN2A/B; listed in the TARGET database. Biallelic inactivation of CDKN2A/B may predict response to CDK4/6 inhibitors for this patient.

