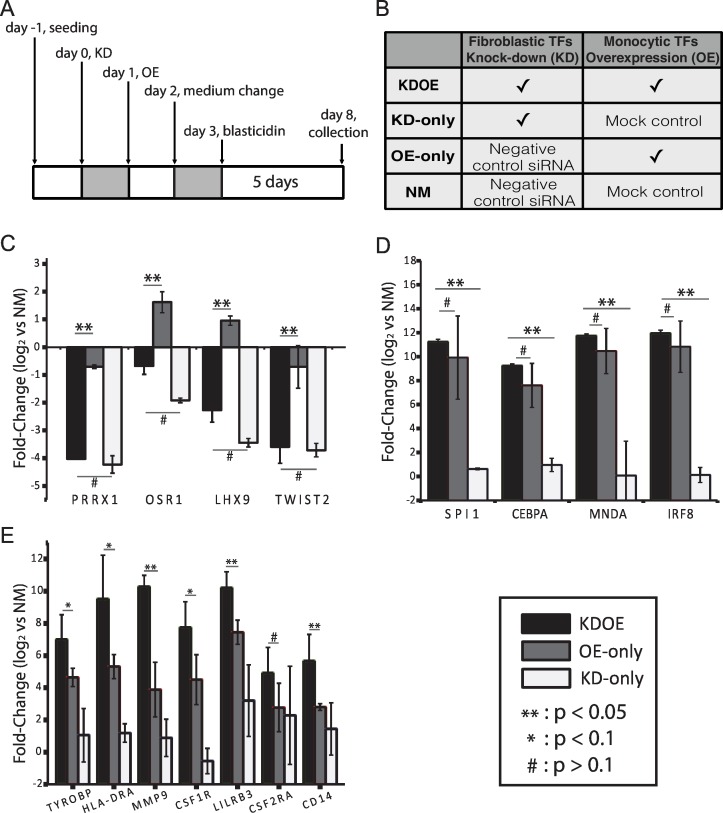
Fig 1. Experimental design and confirmation of knock-down as well as induction of target TF genes.
(A) Flow chart of experimental design. Four fibroblastic TFs were suppressed by using siRNA transfection on day 0, and four monocyte TFs were overexpressed on day 1. The monocyte medium was introduced at day 2, followed by sample collection on day 8. (B) Parallel experiments were performed for comparison. (C and D) Validation of four fibroblastic TF knockdown and four monocytic TF induction, respectively. (E) qPCR analysis of monocyte makers revealed increased gene expression levels in KDOE. Independent experiments were repeated a minimum of three times (**: p <0.05, *: p <0.1, #: p >0.1, t-test, black bar: KDOE, gray bar: OE-only, white bar: KD-only).

