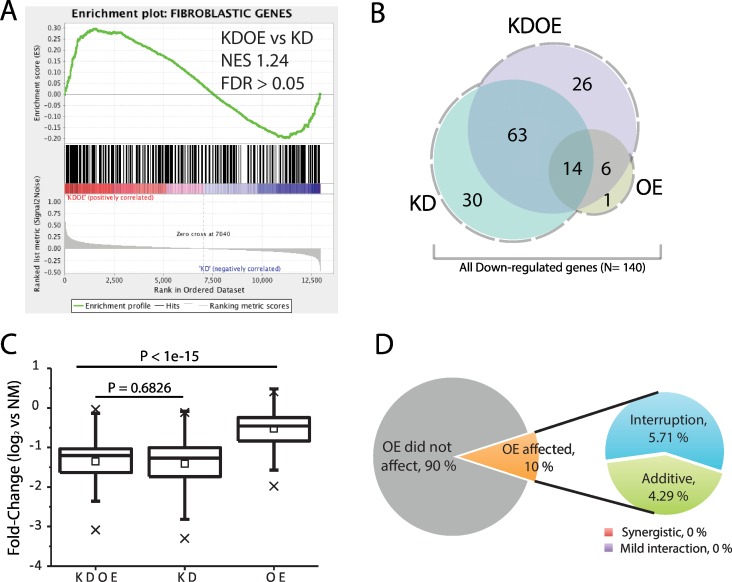
Fig 4. Poor regulations of monocytic TRN in fibroblastic gene suppression.
(A) The enrichment was insignificant when we analyzed KDOE against KD-only. (B) Venn diagram showing overlapped gene numbers downregulated in each treatment. (C) The box-plot for fold-change distributions of all genes downregulated (N = 140, x: 1% and 99%, ☐: mean). (D) The interactions of two TRNs affecting fibroblastic gene suppression.

