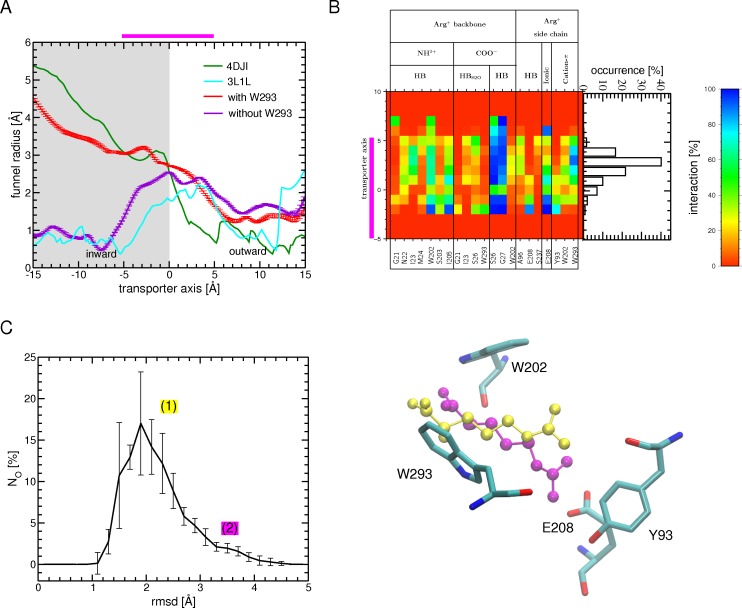
Fig 5. Transition from the occluded to the IF open substrate-bound state.
(A) The profile of the funnel radius as a function of position along the main axis of the transporter, averaged over the last 0.1 ns of one tMD simulation is shown with (red) and without (violet) the inclusion of Trp293 in the targeted atom ensemble (see text). The standard error is shown as bars. The radius is also depicted for the IF open GadC (4DJI, green) and the occluded AdiC (3L1L, cyan) crystal structures. (B) Interactions (H bonds, ionic and cation-π) formed by the Arg+ backbone or side chain with protein residues during all tMD trajectories. Only interactions with an occurrence higher than 20% in at least one bin width from all 24 binding events of the 12 tMD trajectories are shown. The abbreviations used for the different interactions are listed in the legend of Fig 2. The binding site region (-5 to 5 Å) is highlighted by a magenta bar in (A) and (B). (C) (left) Number of occurrences (NO) for finding the substrate at a certain RMSD value, computed for the carbon atoms of Arg+ using all tMD simulations and its crystal position in the occluded state (PDB ID: 3L1L) as a reference (left). The standard error is shown as bars. Two different Arg+ positions (labelled (1) and (2)) are depicted. The position (1) (in yellow CPK) corresponds to the position with the highest occurrence and the (2) (in magenta CPK) features Arg+ with its sidechain reoriented towards Glu208. Surrounding binding site residues are shown as sticks (atom type colored). These two positions are marked with their number on the RMSD plot.

