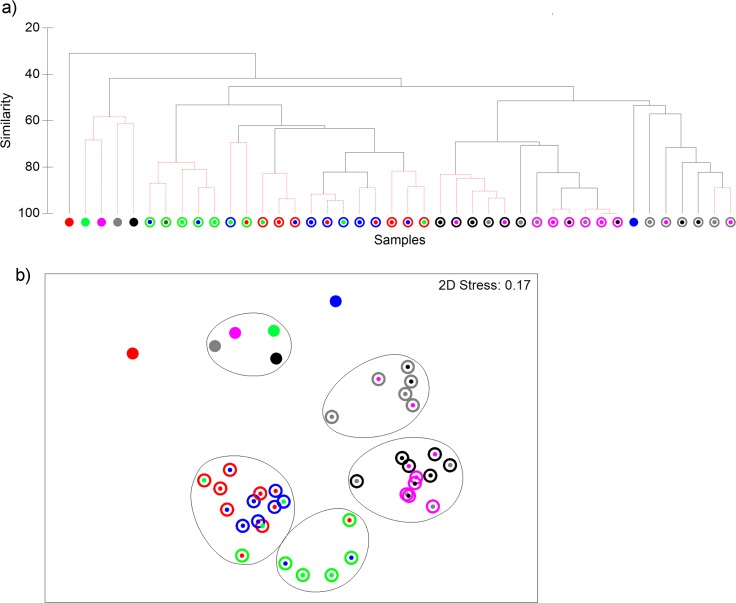
Fig 3.
Eubacterial DNA profiles of saliva from six volunteers (indicated by red, green, pink, blue, grey and black colours) analysed by cluster analysis (a) and non-metric MDS (b). Closed circles, whole saliva, open circles, saliva eubacterial fractions selected by antibodies from volunteers as indicated by coloured centre spots. DNA profiles differed significantly between individuals for microbiota (P≤ 0.001%, R = 0.475); between microbiota selected by self vs non-self-antibodies (P≤ 0.001, R = 0.42); according to microbiota and immunoglobulin origin (P≤ 0.001, R = 0.63), but not immunoglobulin isotype (p = 0.2, R = 0.029). Robustness of clusters (p≤ 0.05) is indicted in red, based on the SIMPROF test in PRIMER v6. Contour lines on the MDS plot superimpose 55% resemblance levels derived from cluster analysis.

