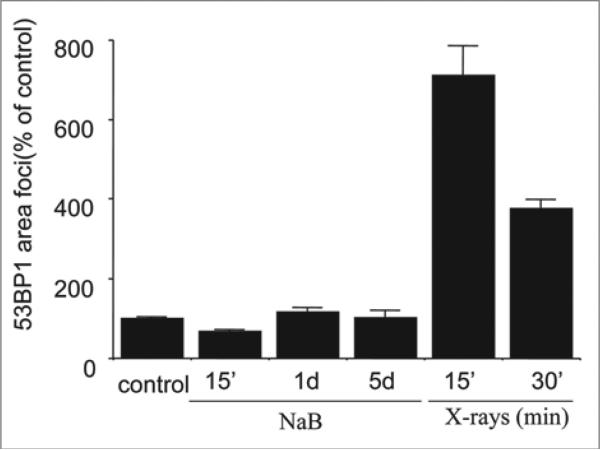
Figure 3.
53BP1 foci area in NaB treated and irradiated E1A + Ras cells. Cells were treated with NaB 15 min (15’), 1 day and 5 days or irradiated (6 Gy) and incubated for 15 min or 30 min before fixation. IPLab software was used for quantification of the focus area. Approximately 100 cells were analyzed for each time point. Bars indicate Standard Error (SE). Results are shown as percent of control (no treatment).

