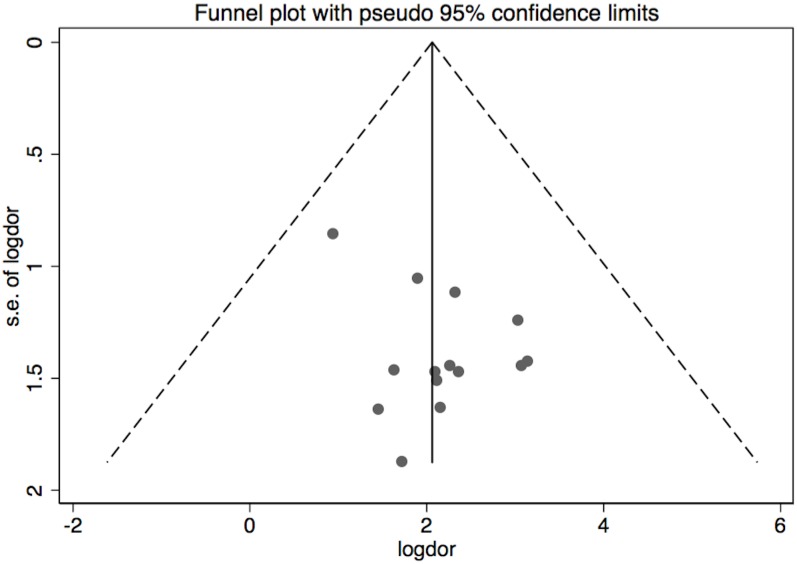
Fig 2. Begg's funnel scatterplot analysis of selected studies.
The graph plots the logarithmic values of diagnostic odds ratios (logDOR) of considered studies in the abscissae axis against the standard error of logDOR in the ordinate axis. The two lines delimiting the inversed funnel denote pseudo 95% confidence intervals. Note the absence of any funnel plot asymmetry (confirmed by Egger´s testing).

