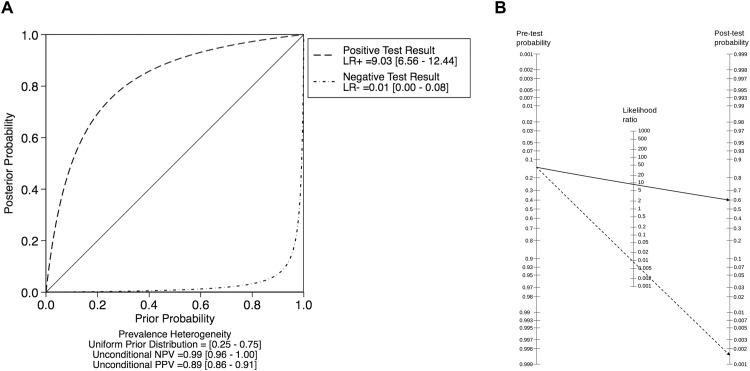
Fig 5. Pre- and post-test probabilities.
A. Probability modifying plot. Note that post-test probabilities below 2% are achieved up to pre-test probabilities of 60%. B. Fagan´s Nomogram applying pooled positive (plain line) and negative (dashed line) likelihood ratios to a pretest probability of 25% (the 95% CI upper bond of pooled prevalence of malignancy in all selected studies). Resulting posttest probabilities were 60% and 0.15% for a positive or a negative MRI result, respectively.

