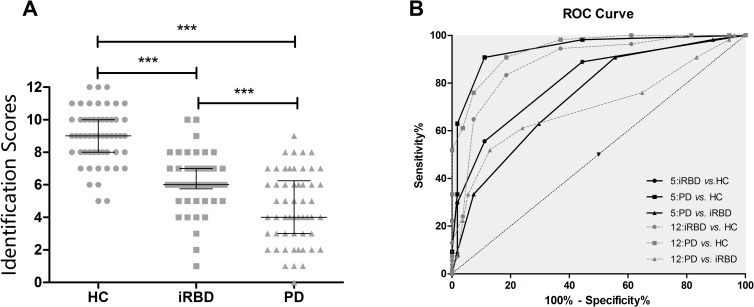
Fig 1. Differentiation among HC, iRBD and PD patients by the odor identification tests.
(A) Scatterplots of individual scores with the respective group median and 25th and 75th percentiles for the Sniffin’ Sticks. (B) Receiver Operating Characteristic (ROC) curves showing the relationship between sensitivity and specificity of the Sniffin’ Sticks (dotted lines) and the brief test (solid lines). ***P<0.001

