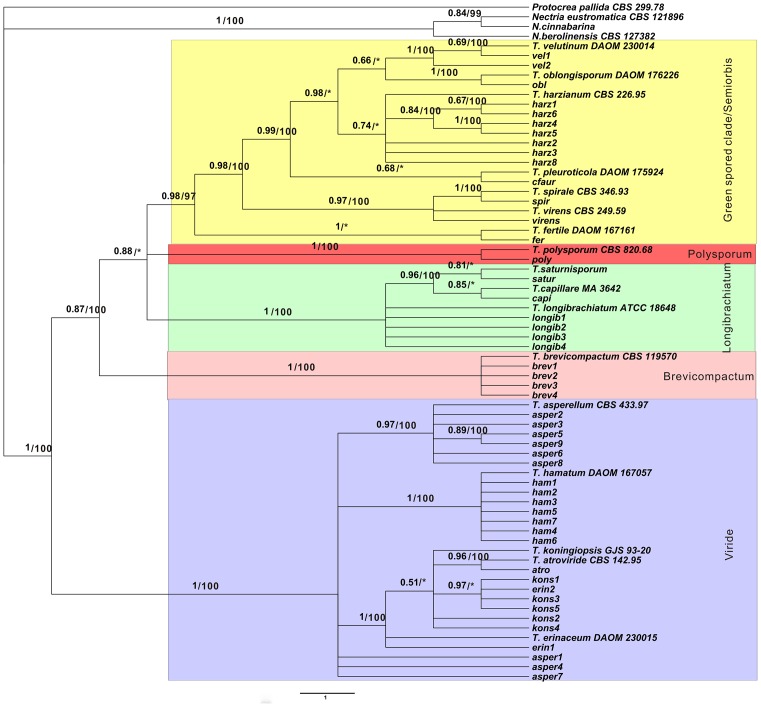
Fig 1. Phylogenetic tree inferred from ITS rDNA sequences.
Bayesian posterior probabilities followed by maximum parsimony bootstrap values above 50 with 1000 replications are shown at the branch. Branches marked with an asterisk indicated that the branches were not present or have bootstrap values below 50 in the maximum parsimony tree. The bar represents 1.0 substitution per site.

