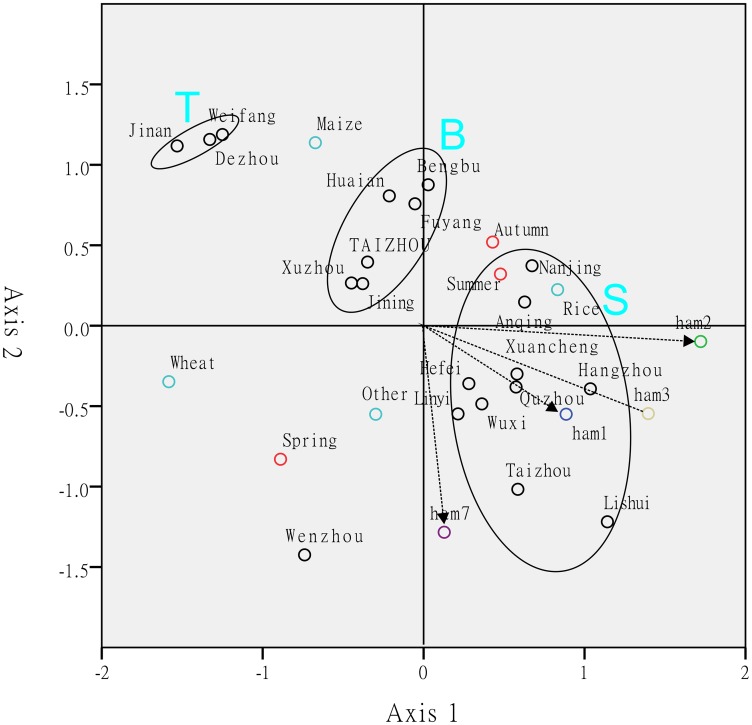
Fig 5. Multiple correspondence analysis of sampling sites based on the existence of T. hamatum.
The inertia of the first and second axes is 0.33 and 0.28, respectively. Ellipsoids show the centre of the regions. S is the region of subtropical monsoon climate, T is the region of temperate monsoon climate, and B is the boundary region between the subtropical monsoon and the temperate monsoon climatic regions. Red circles indicate the seasons and cyan circles indicate the crop types. Other colored circles indicate the main haplotypes of T. hamatum.

